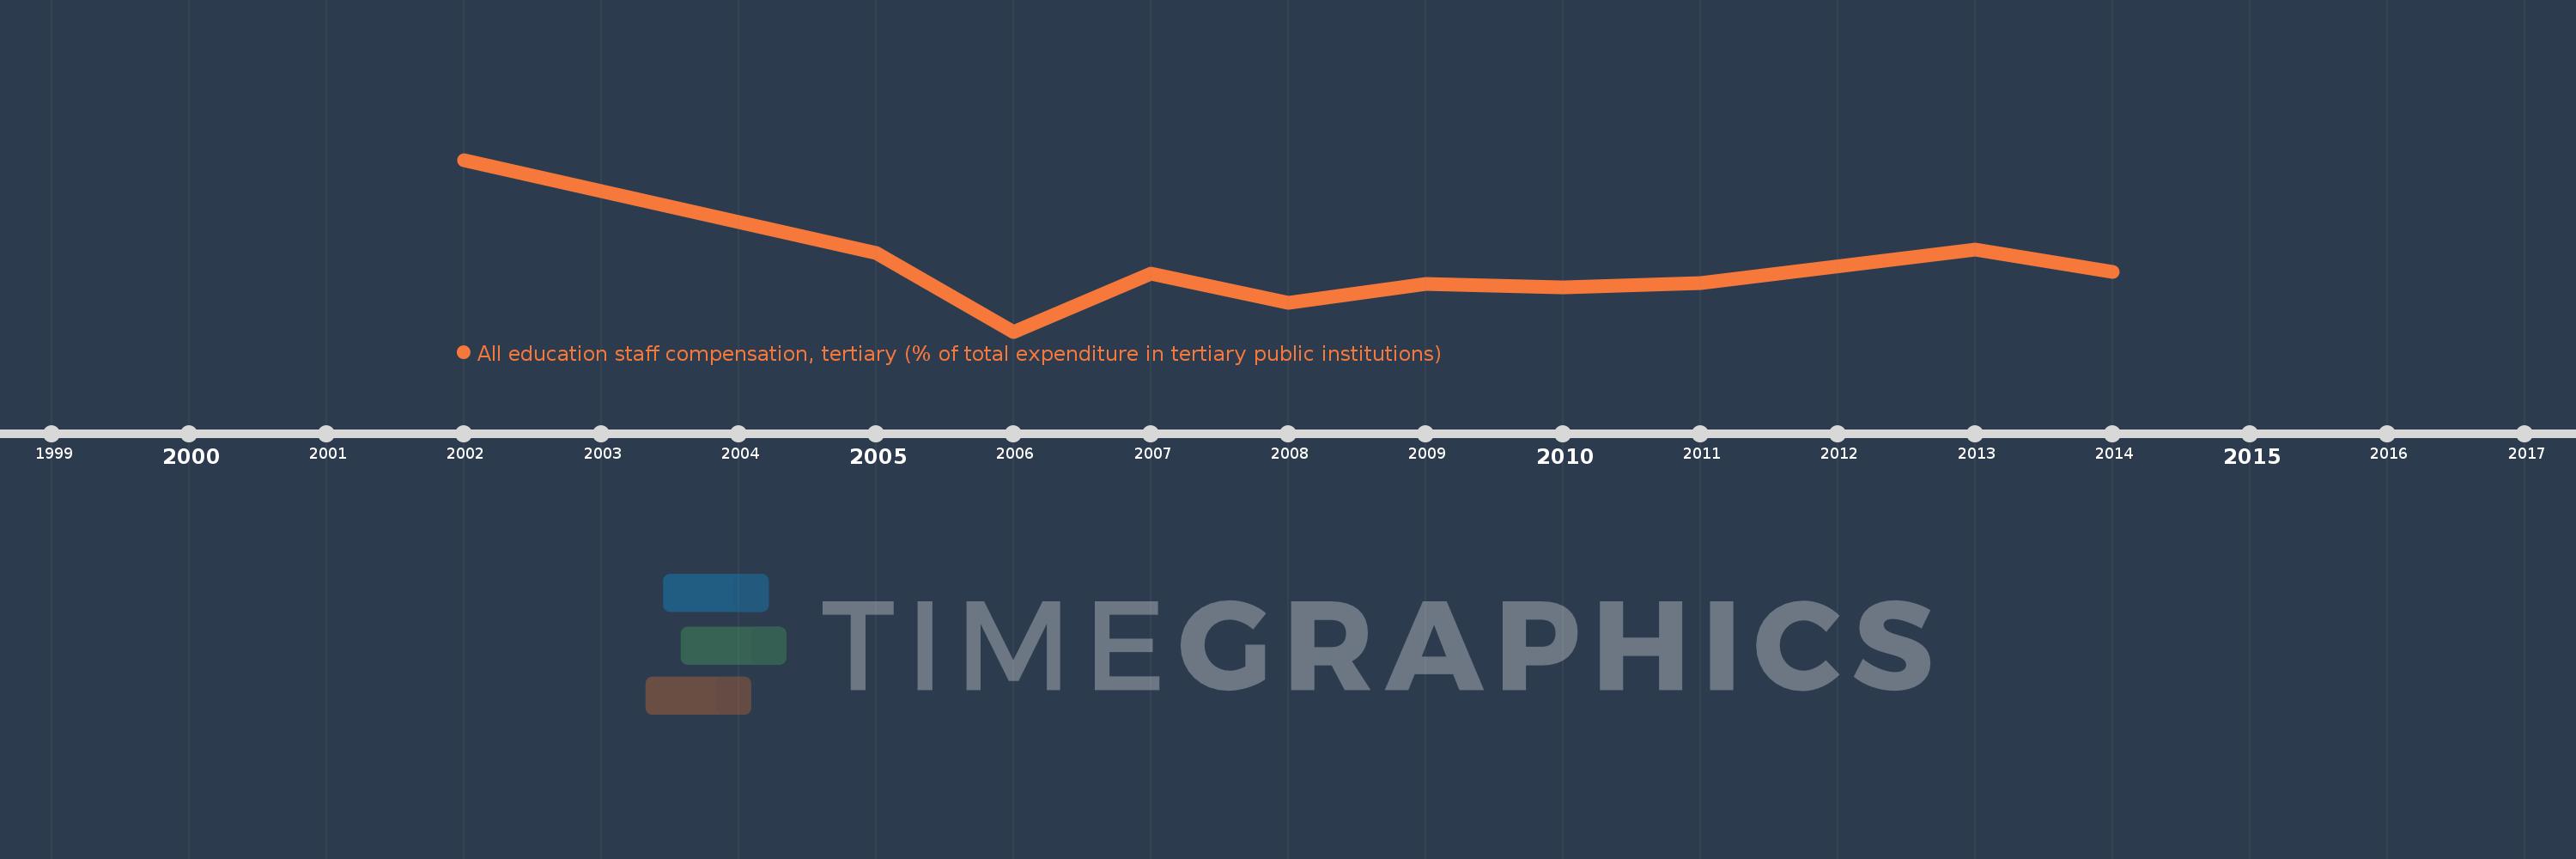
Questa scala temporale mostra un grafico dal 2002 anno al 2014 anno. Ghana. I dati fino ad 2001 anno non disponibili. Il numero di osservazioni attuali secondo i date: 10.
La fonte (nome):
Indicatori dello sviluppo mondiale
La fonte (organizzazione):
United Nations Educational, Scientific, and Cultural Organization (UNESCO) Institute for Statistics.
Categorie:
Education
sono stati aggiornati
23 apr 2017 anni
Indicatori delle variazioni dei valori per anni
In media:
58.357
Minima:
39.641
1 gen 2006 anni
Massimo:
91.484
1 gen 2002 anni
Alla data di osservazione
Valore
Variazione assoluta
La variazione rispetto al valore precedente
1 gen 2002 anni
91.484
+91.484
0.0%
1 gen 2005 anni
63.415
-28.069
-30.68%
1 gen 2006 anni
39.641
-23.774
-37.49%
1 gen 2007 anni
57.221
+17.58
44.35%
1 gen 2008 anni
48.42
-8.801
-15.38%
1 gen 2009 anni
53.928
+5.508
11.38%
1 gen 2010 anni
53.018
-0.91
-1.69%
1 gen 2011 anni
54.39
+1.372
2.59%
1 gen 2013 anni
64.396
+10.006
18.4%
1 gen 2014 anni
57.655
-6.741
-10.47%
Classificazione dei paesi secondo i statistiche attuali per anni