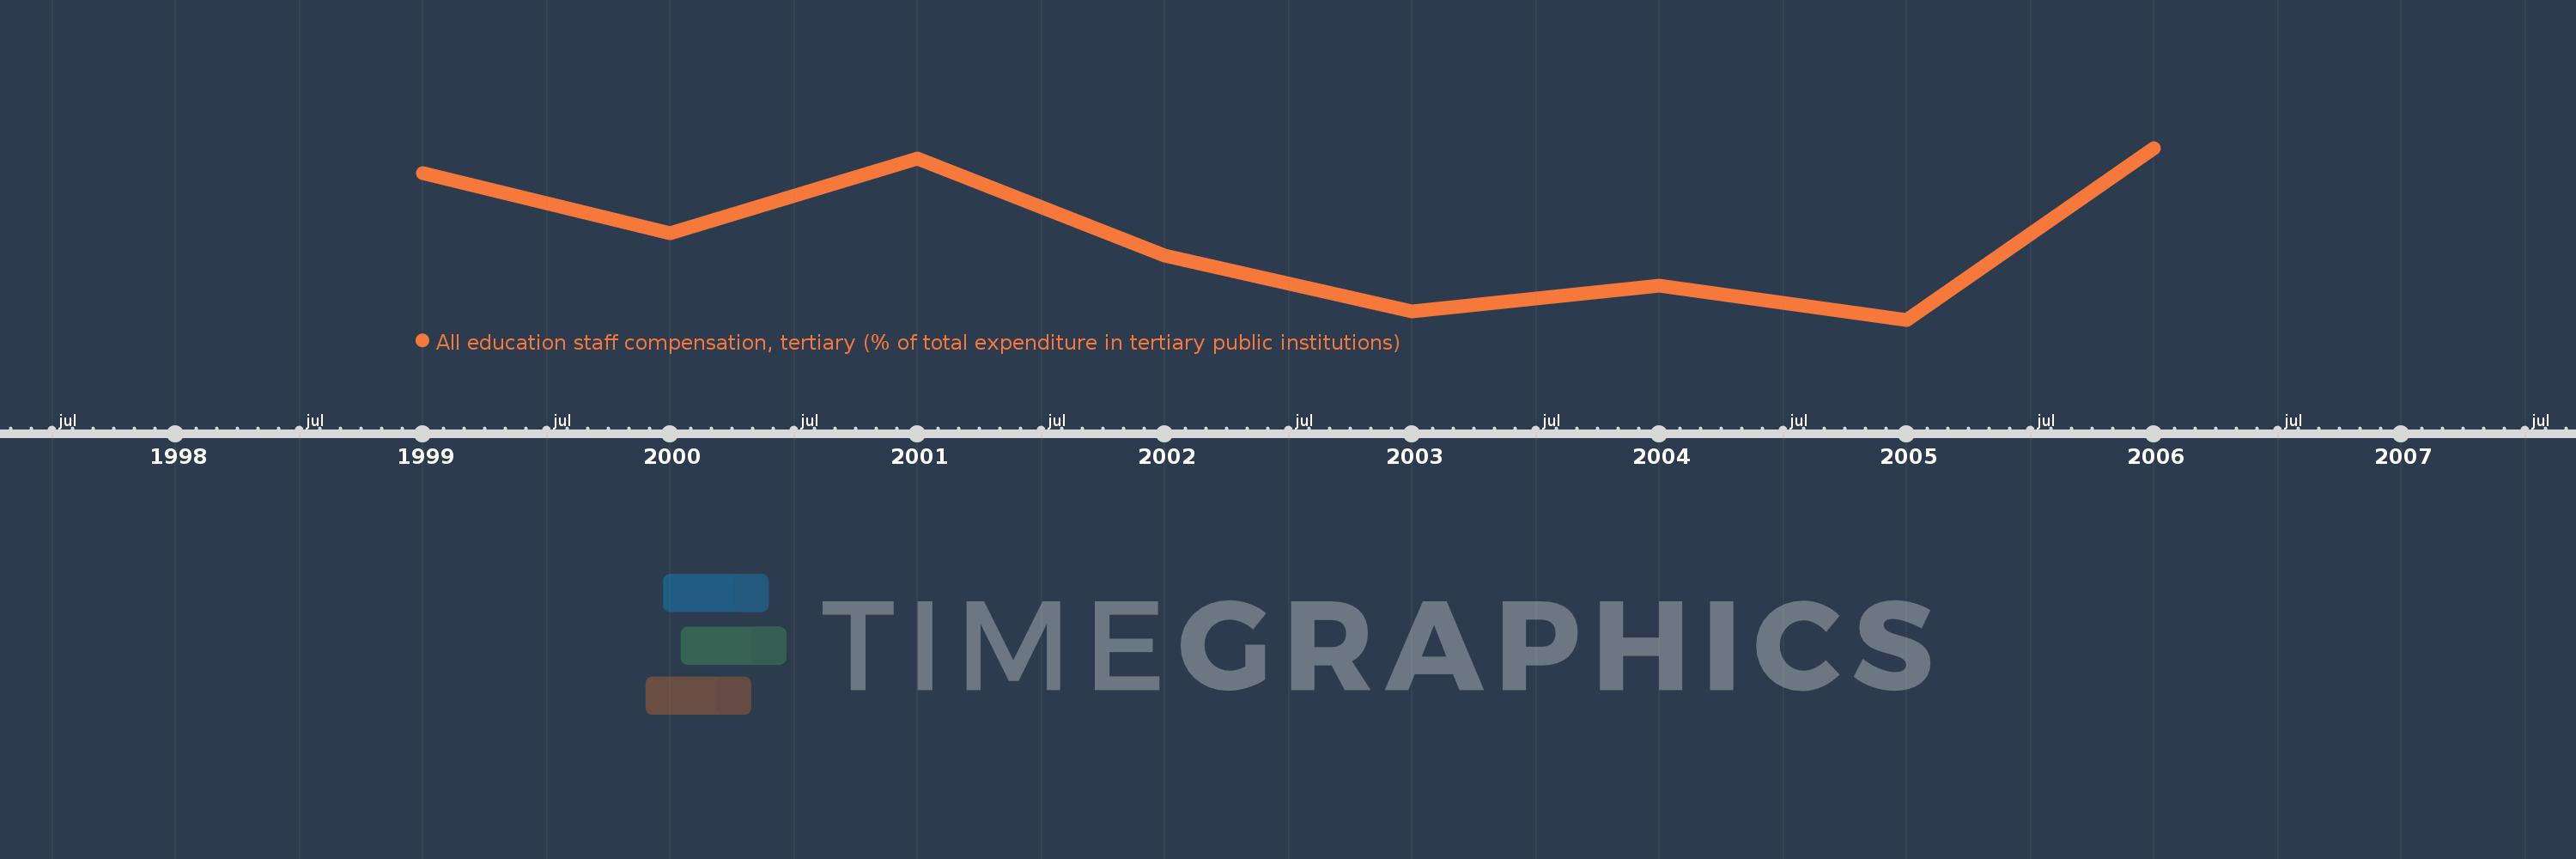
Questa scala temporale mostra un grafico dal 1999 anno al 2006 anno. Greece. I dati fino ad 1998 anno non disponibili. Il numero di osservazioni attuali secondo i date: 8.
La fonte (nome):
Indicatori dello sviluppo mondiale
La fonte (organizzazione):
United Nations Educational, Scientific, and Cultural Organization (UNESCO) Institute for Statistics.
Categorie:
Education
sono stati aggiornati
23 apr 2017 anni
Indicatori delle variazioni dei valori per anni
In media:
36.455
Minima:
27.085
1 gen 2005 anni
Massimo:
46.215
1 gen 2006 anni
Alla data di osservazione
Valore
Variazione assoluta
La variazione rispetto al valore precedente
1 gen 1999 anni
43.447
+43.447
0.0%
1 gen 2000 anni
36.723
-6.724
-15.48%
1 gen 2001 anni
45.061
+8.338
22.7%
1 gen 2002 anni
34.185
-10.876
-24.14%
1 gen 2003 anni
28.001
-6.185
-18.09%
1 gen 2004 anni
30.924
+2.923
10.44%
1 gen 2005 anni
27.085
-3.839
-12.41%
1 gen 2006 anni
46.215
+19.13
70.63%
Classificazione dei paesi secondo i statistiche attuali per anni