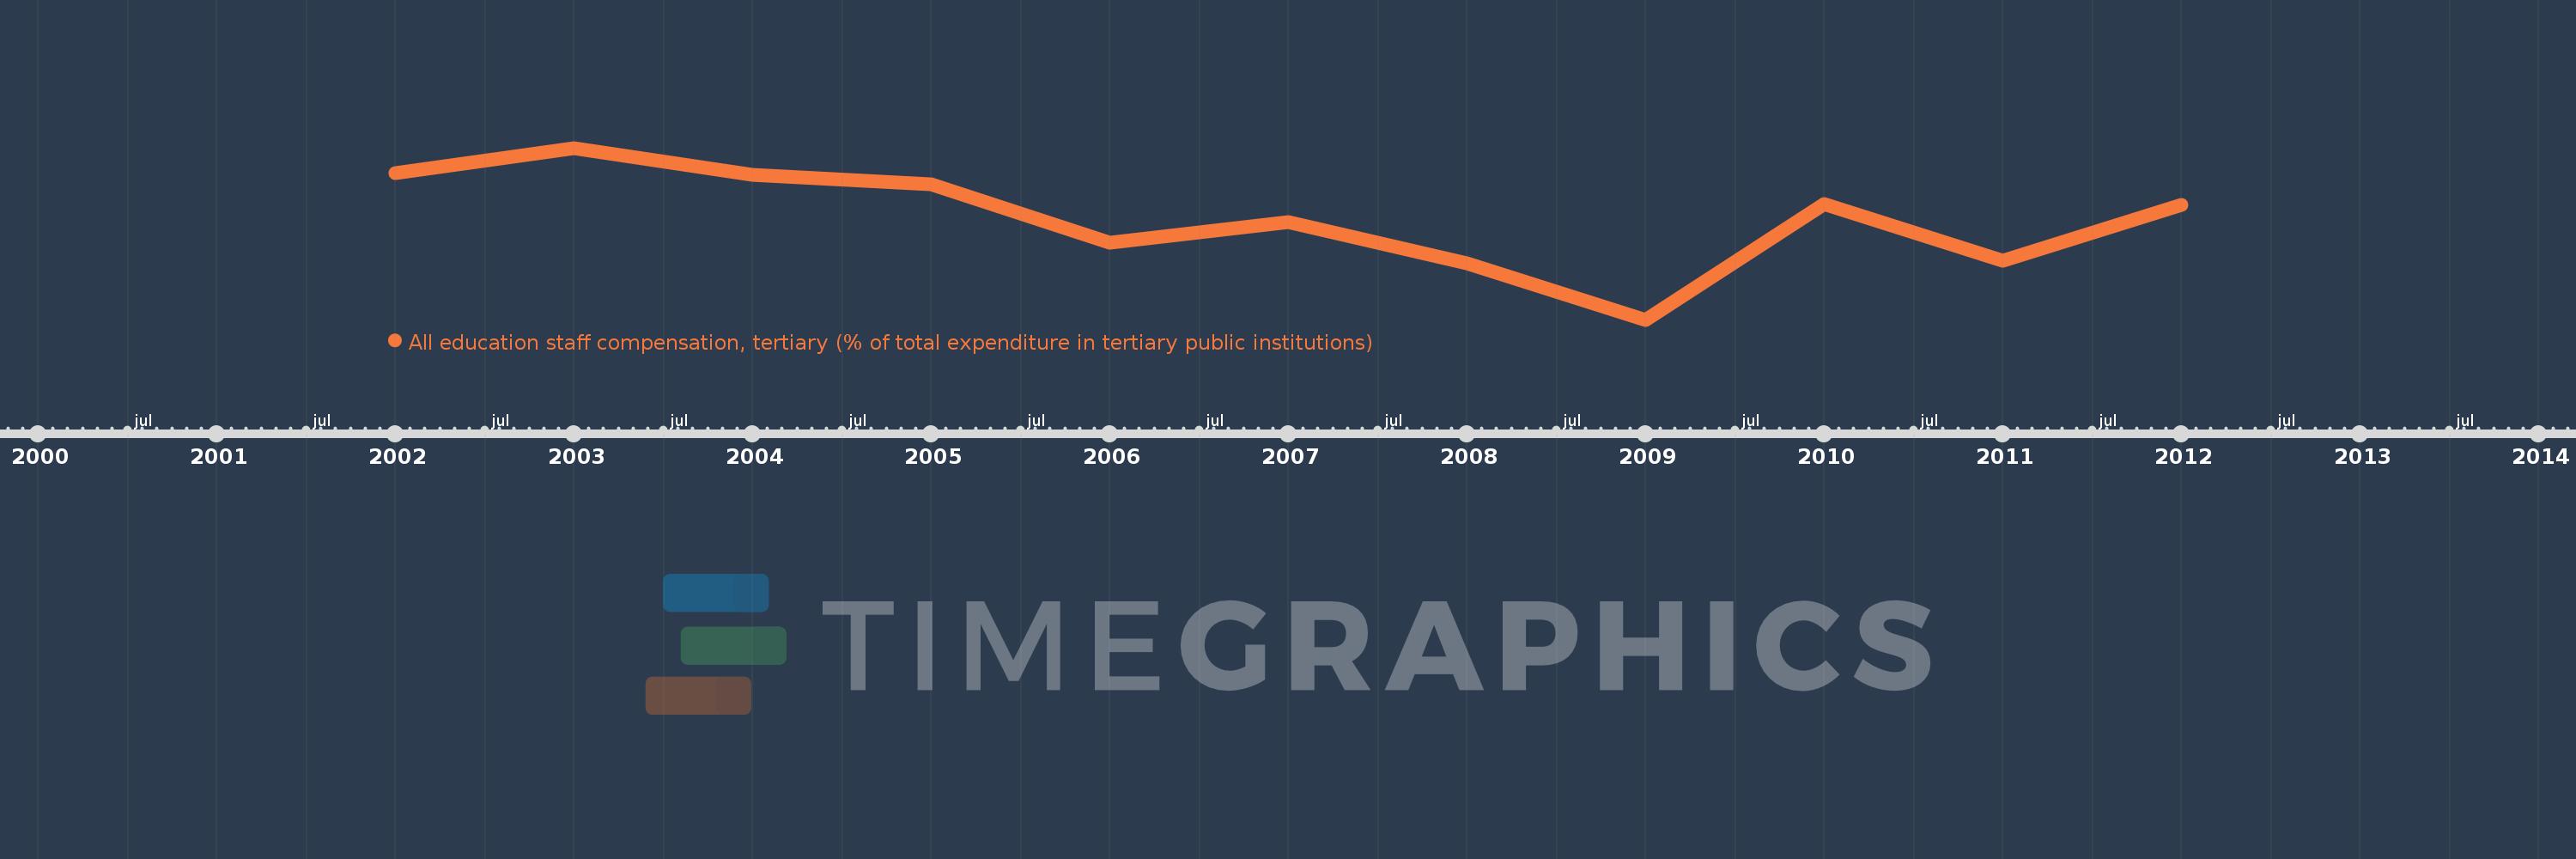
Questa scala temporale mostra un grafico dal 2002 anno al 2012 anno. Mexico. I dati fino ad 2001 anno non disponibili. Il numero di osservazioni attuali secondo i date: 11.
La fonte (nome):
Indicatori dello sviluppo mondiale
La fonte (organizzazione):
United Nations Educational, Scientific, and Cultural Organization (UNESCO) Institute for Statistics.
Categorie:
Education
sono stati aggiornati
23 apr 2017 anni
Indicatori delle variazioni dei valori per anni
In media:
70.251
Minima:
63.049
1 gen 2009 anni
Massimo:
75.209
1 gen 2003 anni
Alla data di osservazione
Valore
Variazione assoluta
La variazione rispetto al valore precedente
1 gen 2002 anni
73.452
+73.452
0.0%
1 gen 2003 anni
75.209
+1.756
2.39%
1 gen 2004 anni
73.276
-1.933
-2.57%
1 gen 2005 anni
72.646
-0.629
-0.86%
1 gen 2006 anni
68.473
-4.173
-5.74%
1 gen 2007 anni
69.983
+1.51
2.21%
1 gen 2008 anni
67.051
-2.932
-4.19%
1 gen 2009 anni
63.049
-4.002
-5.97%
1 gen 2010 anni
71.233
+8.185
12.98%
1 gen 2011 anni
67.198
-4.036
-5.67%
1 gen 2012 anni
71.186
+3.989
5.94%
Classificazione dei paesi secondo i statistiche attuali per anni