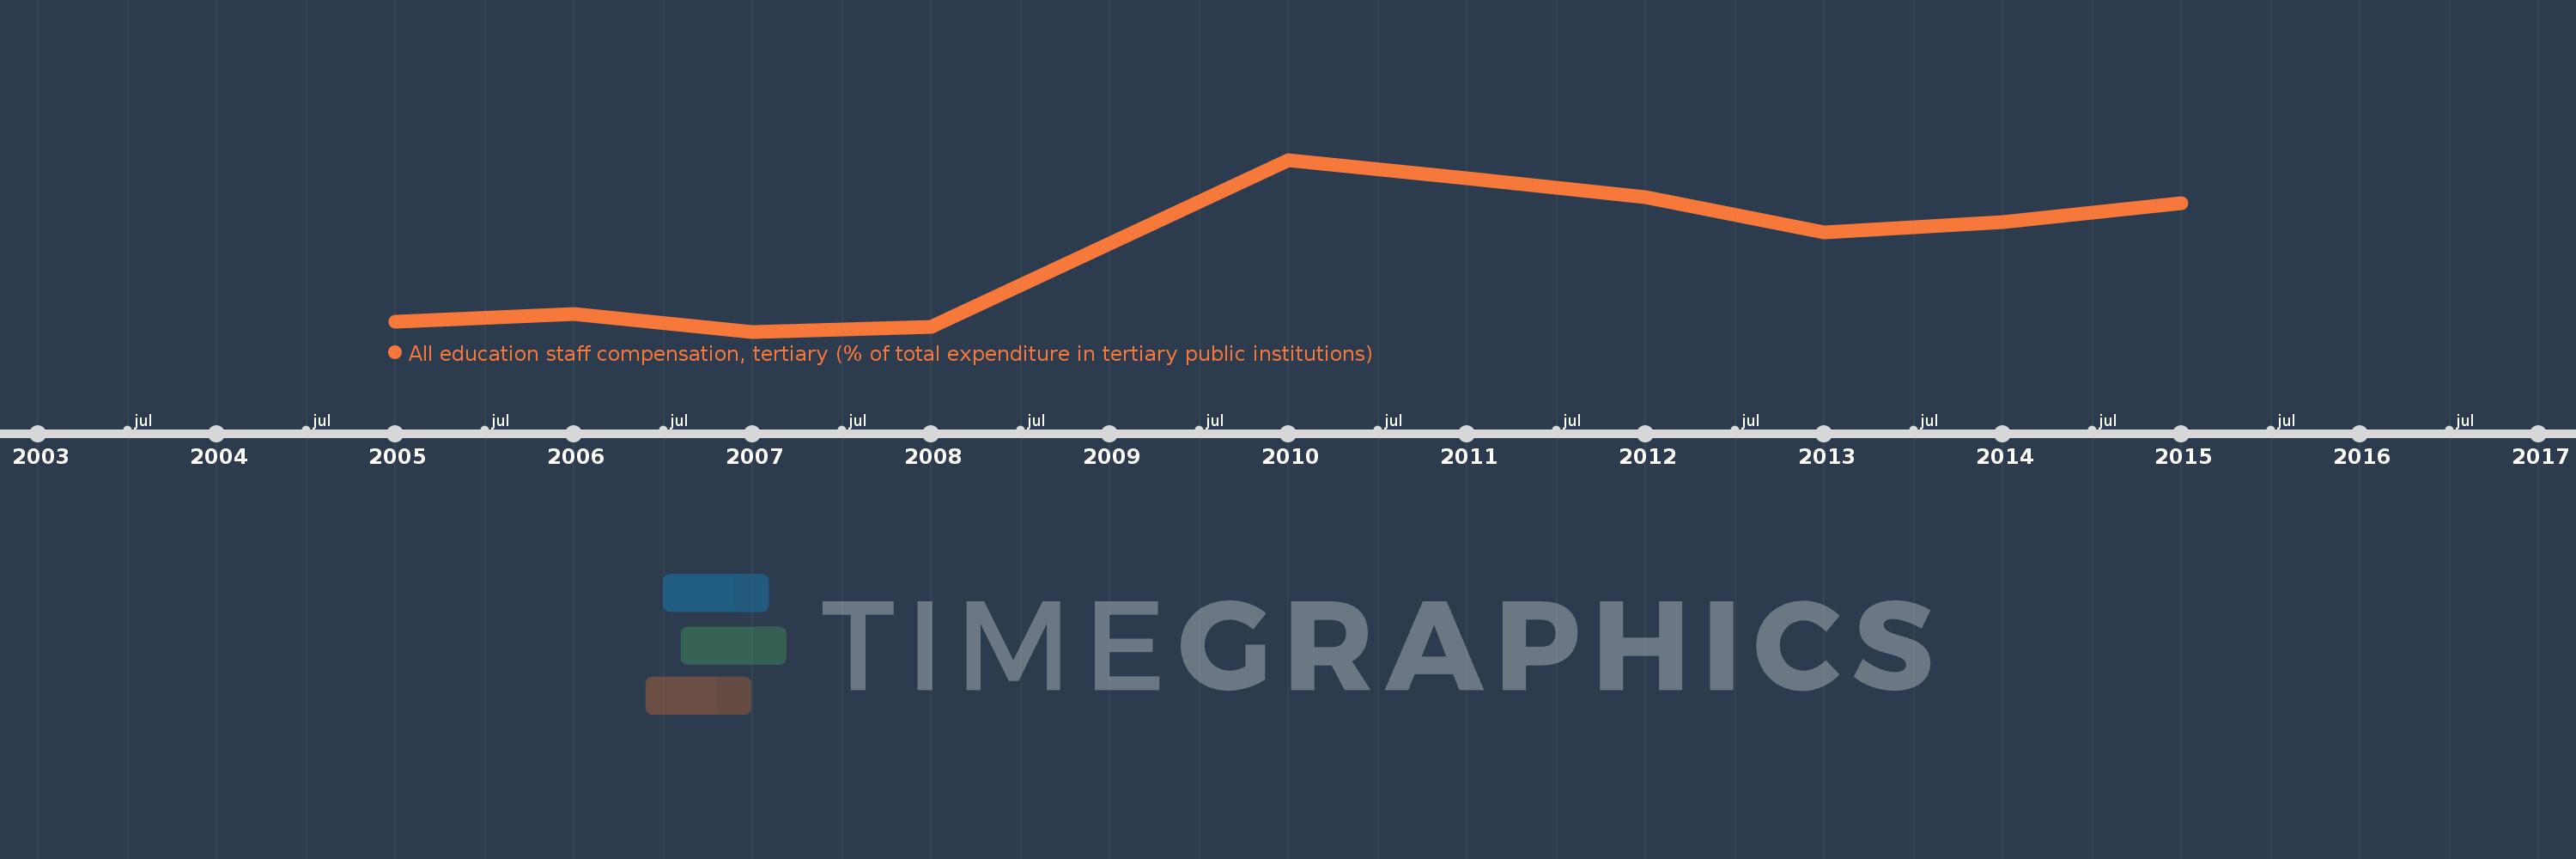
Questa scala temporale mostra un grafico dal 2005 anno al 2015 anno. Belarus. I dati fino ad 2004 anno non disponibili. Il numero di osservazioni attuali secondo i date: 10.
La fonte (nome):
Indicatori dello sviluppo mondiale
La fonte (organizzazione):
United Nations Educational, Scientific, and Cultural Organization (UNESCO) Institute for Statistics.
Categorie:
Education
sono stati aggiornati
23 apr 2017 anni
Indicatori delle variazioni dei valori per anni
In media:
62.868
Minima:
53.302
1 gen 2007 anni
Massimo:
73.146
1 gen 2010 anni
Alla data di osservazione
Valore
Variazione assoluta
La variazione rispetto al valore precedente
1 gen 2005 anni
54.412
+54.412
0.0%
1 gen 2006 anni
55.289
+0.877
1.61%
1 gen 2007 anni
53.302
-1.986
-3.59%
1 gen 2008 anni
53.822
+0.52
0.98%
1 gen 2010 anni
73.146
+19.324
35.9%
1 gen 2011 anni
71.054
-2.092
-2.86%
1 gen 2012 anni
68.828
-2.226
-3.13%
1 gen 2013 anni
64.758
-4.07
-5.91%
1 gen 2014 anni
65.958
+1.199
1.85%
1 gen 2015 anni
68.108
+2.15
3.26%
Classificazione dei paesi secondo i statistiche attuali per anni