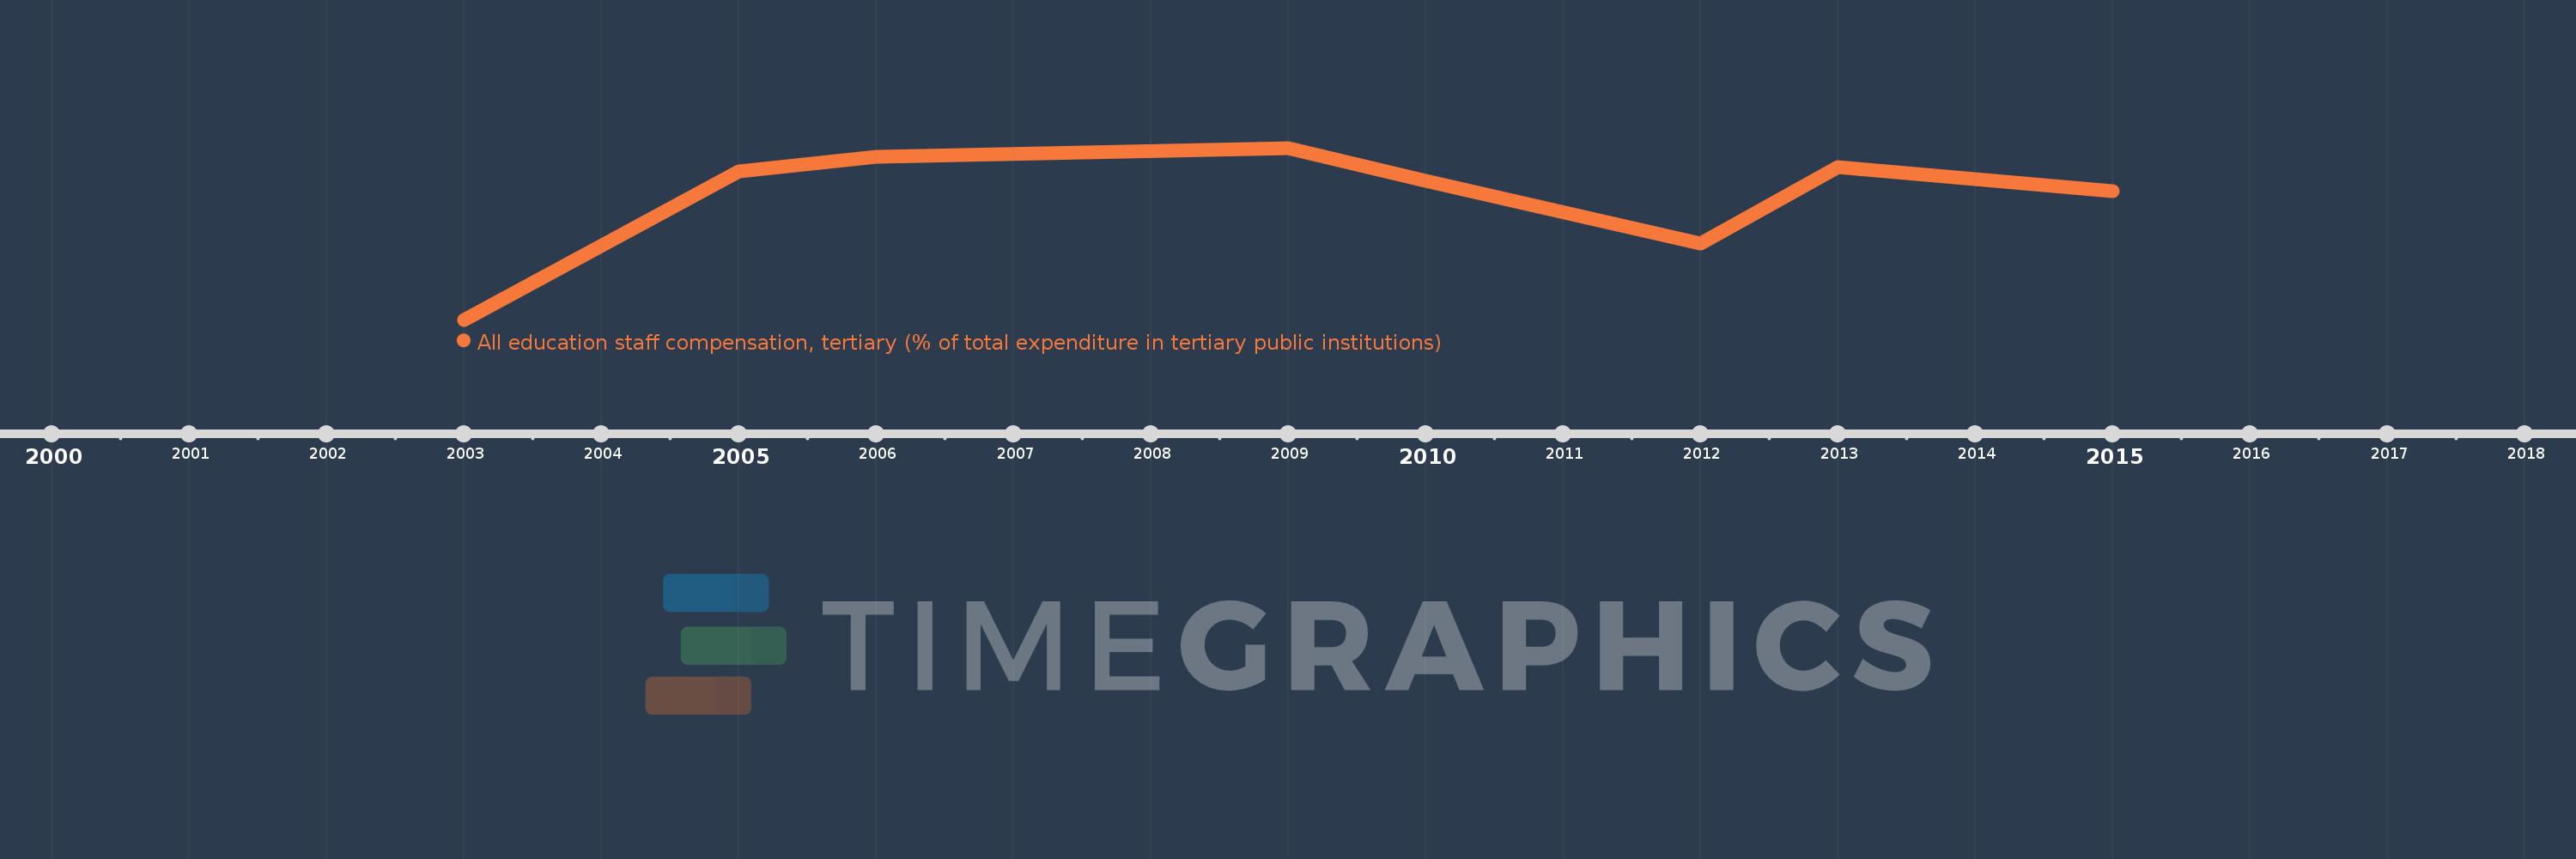
Questa scala temporale mostra un grafico dal 2003 anno al 2015 anno. Caribbean small states. I dati fino ad 2002 anno non disponibili. Il numero di osservazioni attuali secondo i date: 8.
La fonte (nome):
Indicatori dello sviluppo mondiale
La fonte (organizzazione):
United Nations Educational, Scientific, and Cultural Organization (UNESCO) Institute for Statistics.
Categorie:
Education
sono stati aggiornati
23 apr 2017 anni
Indicatori delle variazioni dei valori per anni
In media:
87.803
Minima:
60.701
1 gen 2003 anni
Massimo:
98.738
1 gen 2009 anni
Alla data di osservazione
Valore
Variazione assoluta
La variazione rispetto al valore precedente
1 gen 2003 anni
60.701
+60.701
0.0%
1 gen 2005 anni
93.455
+32.754
53.96%
1 gen 2006 anni
96.751
+3.296
3.53%
1 gen 2009 anni
98.738
+1.986
2.05%
1 gen 2010 anni
91.413
-7.325
-7.42%
1 gen 2012 anni
77.664
-13.75
-15.04%
1 gen 2013 anni
94.55
+16.886
21.74%
1 gen 2015 anni
89.154
-5.396
-5.71%
Classificazione dei paesi secondo i statistiche attuali per anni