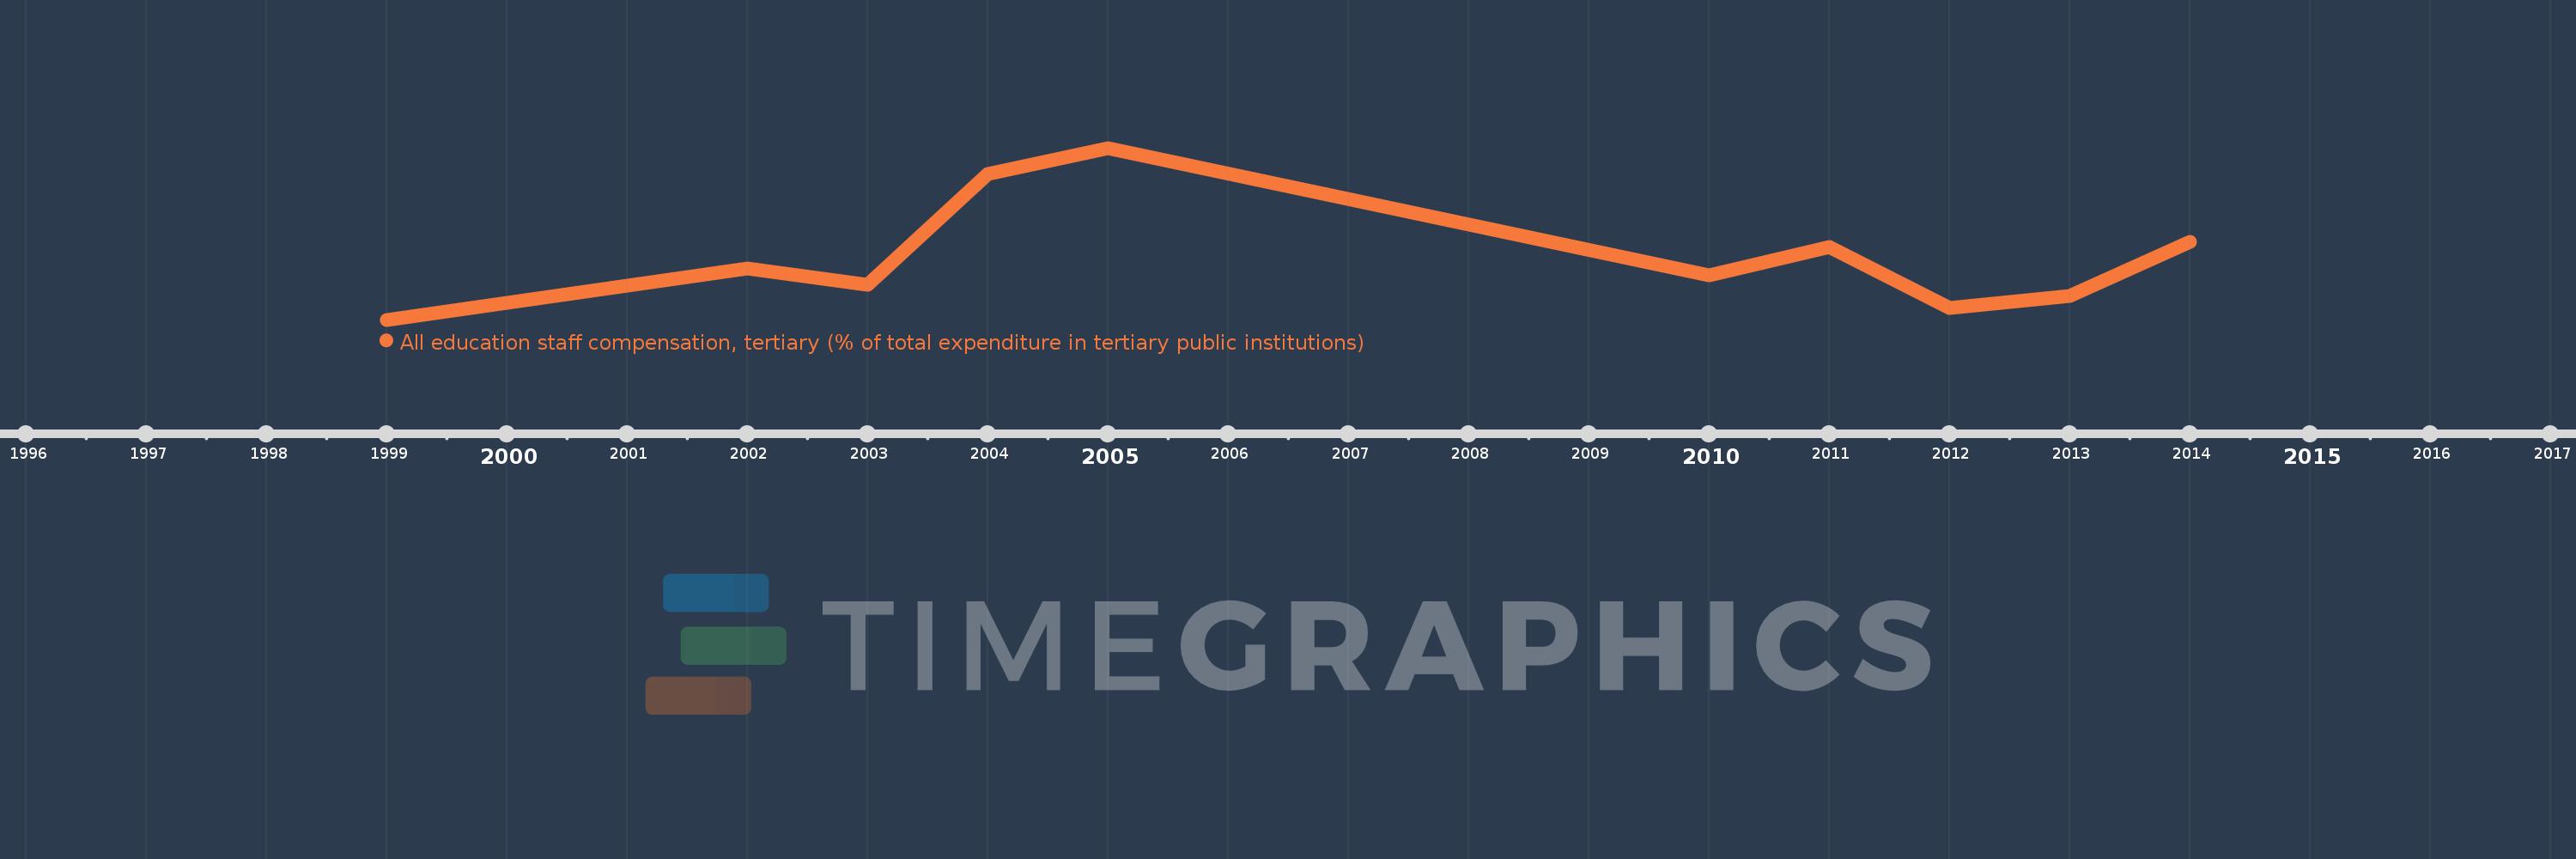
Questa scala temporale mostra un grafico dal 1999 anno al 2014 anno. Romania. I dati fino ad 1998 anno non disponibili. Il numero di osservazioni attuali secondo i date: 10.
La fonte (nome):
Indicatori dello sviluppo mondiale
La fonte (organizzazione):
United Nations Educational, Scientific, and Cultural Organization (UNESCO) Institute for Statistics.
Categorie:
Education
sono stati aggiornati
23 apr 2017 anni
Indicatori delle variazioni dei valori per anni
In media:
53.339
Minima:
43.303
1 gen 1999 anni
Massimo:
70.558
1 gen 2005 anni
Alla data di osservazione
Valore
Variazione assoluta
La variazione rispetto al valore precedente
1 gen 1999 anni
43.303
+43.303
0.0%
1 gen 2002 anni
51.437
+8.134
18.78%
1 gen 2003 anni
48.794
-2.643
-5.14%
1 gen 2004 anni
66.362
+17.569
36.01%
1 gen 2005 anni
70.558
+4.195
6.32%
1 gen 2010 anni
50.287
-20.27
-28.73%
1 gen 2011 anni
54.789
+4.501
8.95%
1 gen 2012 anni
45.193
-9.596
-17.51%
1 gen 2013 anni
47.023
+1.83
4.05%
1 gen 2014 anni
55.64
+8.618
18.33%
Classificazione dei paesi secondo i statistiche attuali per anni