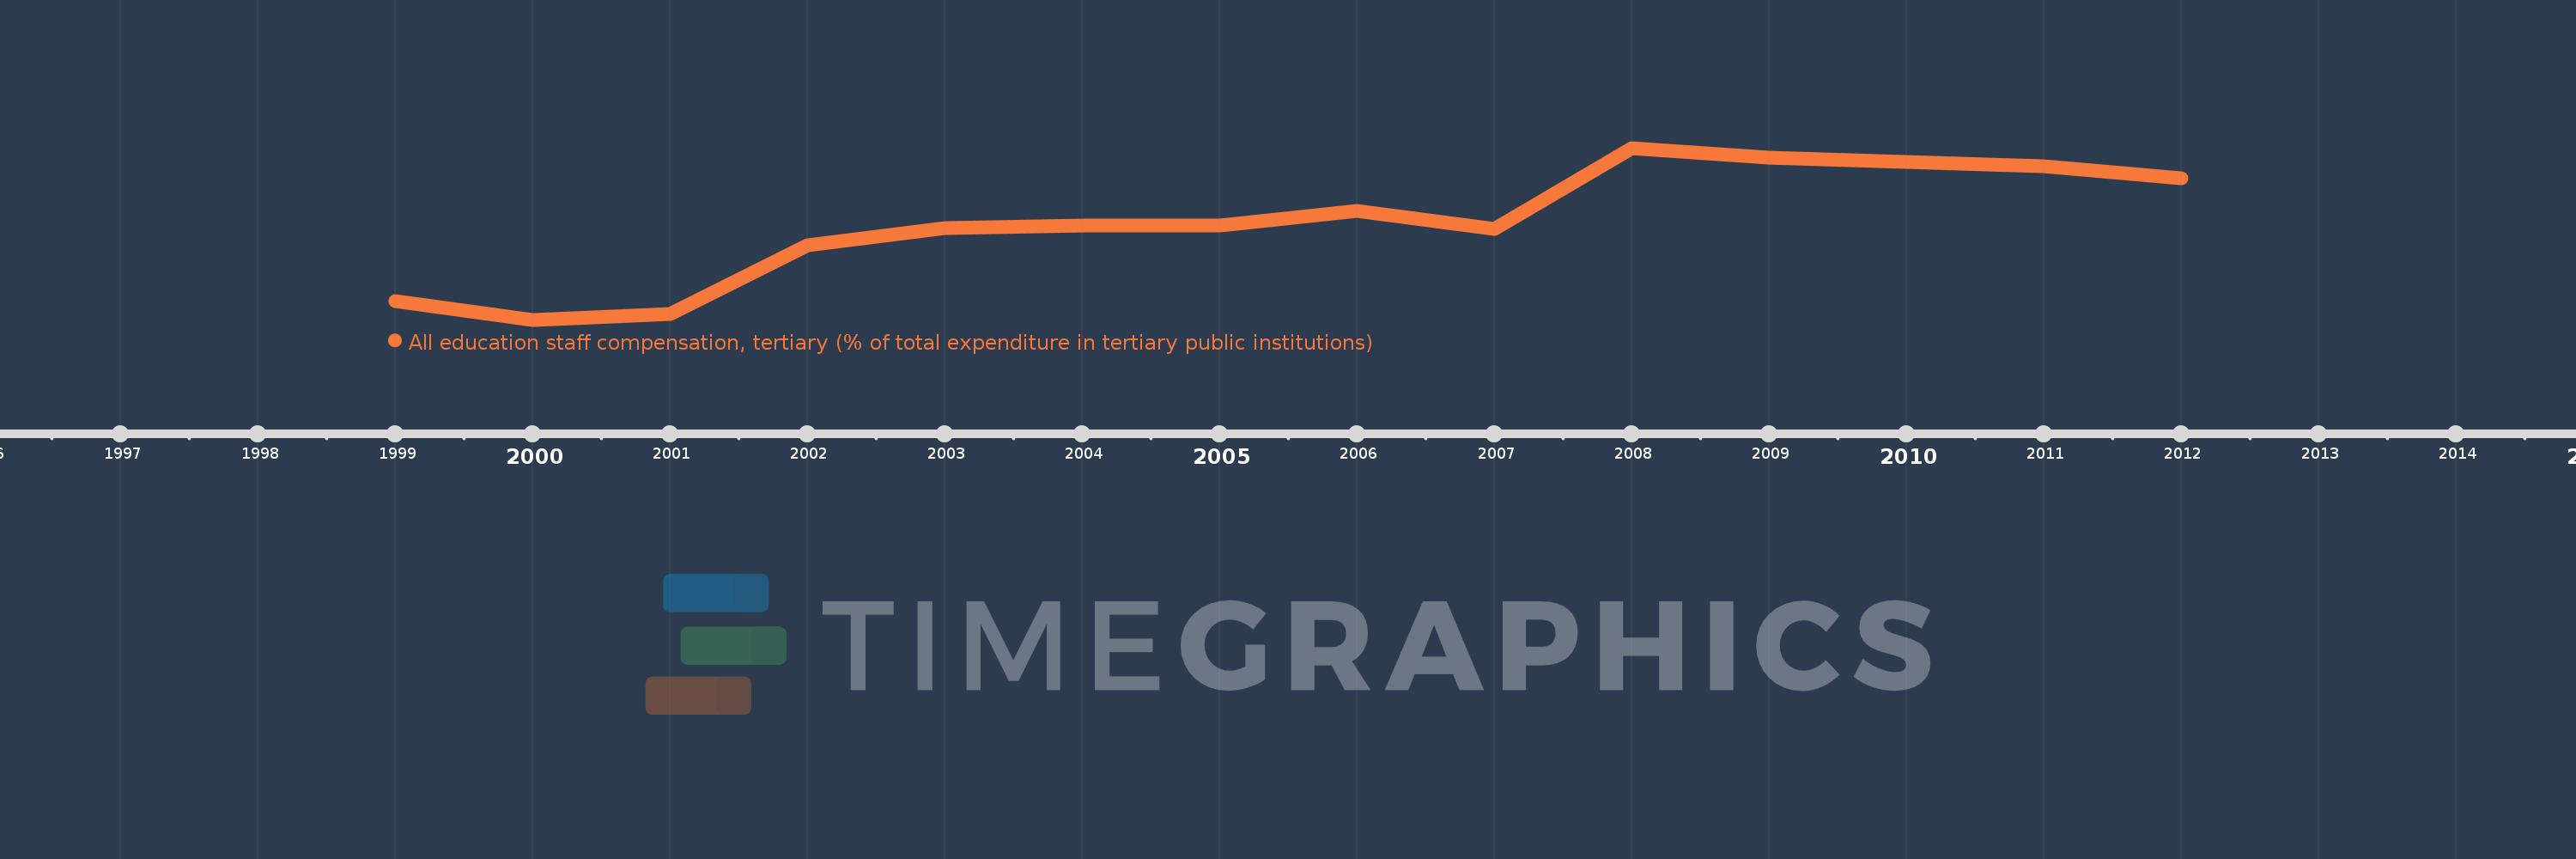
Questa scala temporale mostra un grafico dal 1999 anno al 2012 anno. Denmark. I dati fino ad 1998 anno non disponibili. Il numero di osservazioni attuali secondo i date: 13.
La fonte (nome):
Indicatori dello sviluppo mondiale
La fonte (organizzazione):
United Nations Educational, Scientific, and Cultural Organization (UNESCO) Institute for Statistics.
Categorie:
Education
sono stati aggiornati
23 apr 2017 anni
Indicatori delle variazioni dei valori per anni
In media:
72.884
Minima:
66.001
1 gen 2000 anni
Massimo:
78.733
1 gen 2008 anni
Alla data di osservazione
Valore
Variazione assoluta
La variazione rispetto al valore precedente
1 gen 1999 anni
67.352
+67.352
0.0%
1 gen 2000 anni
66.001
-1.35
-2.0%
1 gen 2001 anni
66.425
+0.424
0.64%
1 gen 2002 anni
71.532
+5.107
7.69%
1 gen 2003 anni
72.816
+1.284
1.8%
1 gen 2004 anni
72.96
+0.144
0.2%
1 gen 2005 anni
72.985
+0.025
0.03%
1 gen 2006 anni
74.058
+1.072
1.47%
1 gen 2007 anni
72.756
-1.302
-1.76%
1 gen 2008 anni
78.733
+5.977
8.22%
1 gen 2009 anni
78.038
-0.694
-0.88%
1 gen 2011 anni
77.353
-0.685
-0.88%
1 gen 2012 anni
76.484
-0.869
-1.12%
Classificazione dei paesi secondo i statistiche attuali per anni