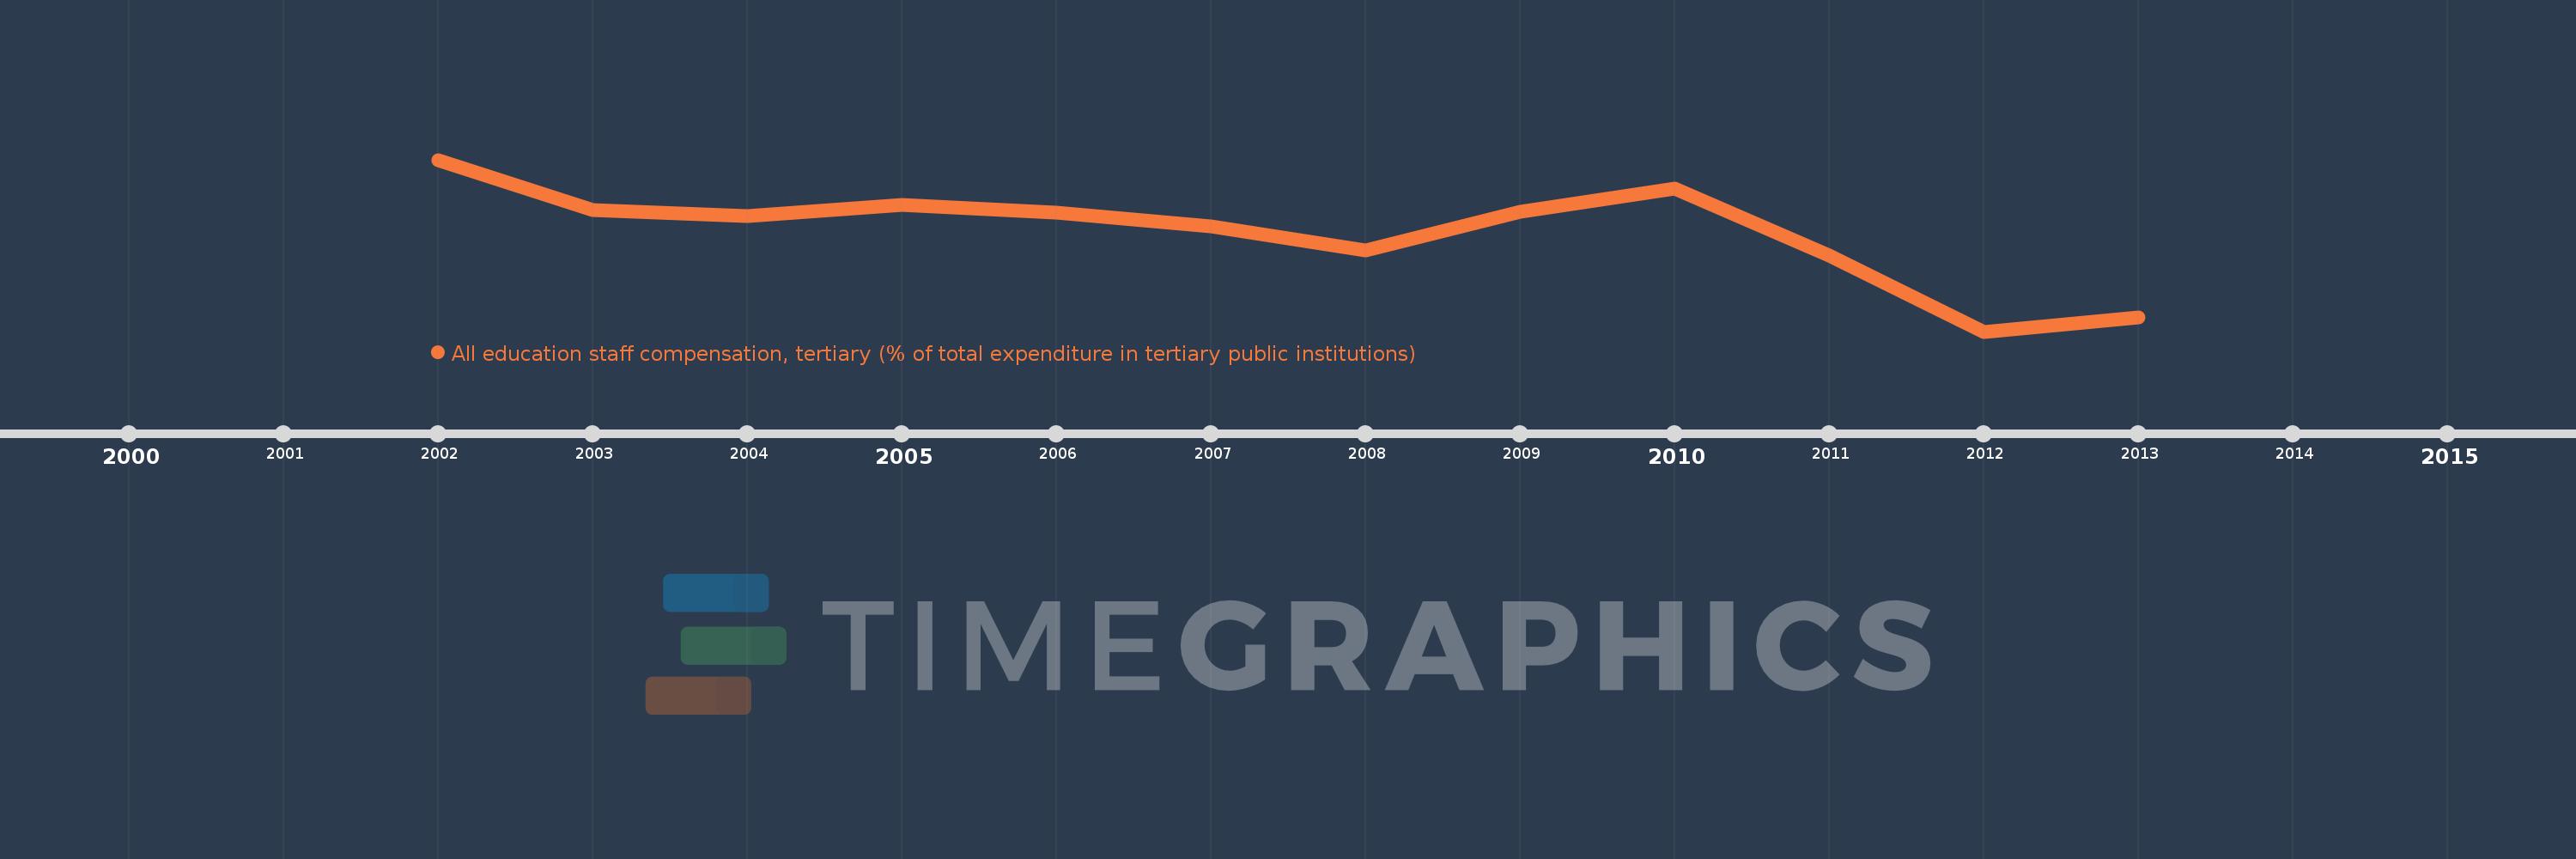
Questa scala temporale mostra un grafico dal 2002 anno al 2013 anno. Lithuania. I dati fino ad 2001 anno non disponibili. Il numero di osservazioni attuali secondo i date: 12.
La fonte (nome):
Indicatori dello sviluppo mondiale
La fonte (organizzazione):
United Nations Educational, Scientific, and Cultural Organization (UNESCO) Institute for Statistics.
Categorie:
Education
sono stati aggiornati
23 apr 2017 anni
Indicatori delle variazioni dei valori per anni
In media:
61.624
Minima:
48.955
1 gen 2012 anni
Massimo:
70.839
1 gen 2002 anni
Alla data di osservazione
Valore
Variazione assoluta
La variazione rispetto al valore precedente
1 gen 2002 anni
70.839
+70.839
0.0%
1 gen 2003 anni
64.412
-6.426
-9.07%
1 gen 2004 anni
63.673
-0.74
-1.15%
1 gen 2005 anni
65.11
+1.437
2.26%
1 gen 2006 anni
64.099
-1.011
-1.55%
1 gen 2007 anni
62.384
-1.715
-2.68%
1 gen 2008 anni
59.285
-3.099
-4.97%
1 gen 2009 anni
64.232
+4.947
8.34%
1 gen 2010 anni
67.121
+2.89
4.5%
1 gen 2011 anni
58.589
-8.532
-12.71%
1 gen 2012 anni
48.955
-9.634
-16.44%
1 gen 2013 anni
50.784
+1.829
3.74%
Classificazione dei paesi secondo i statistiche attuali per anni