Download Queste statistiche in altri paesi:
Linea del tempo:
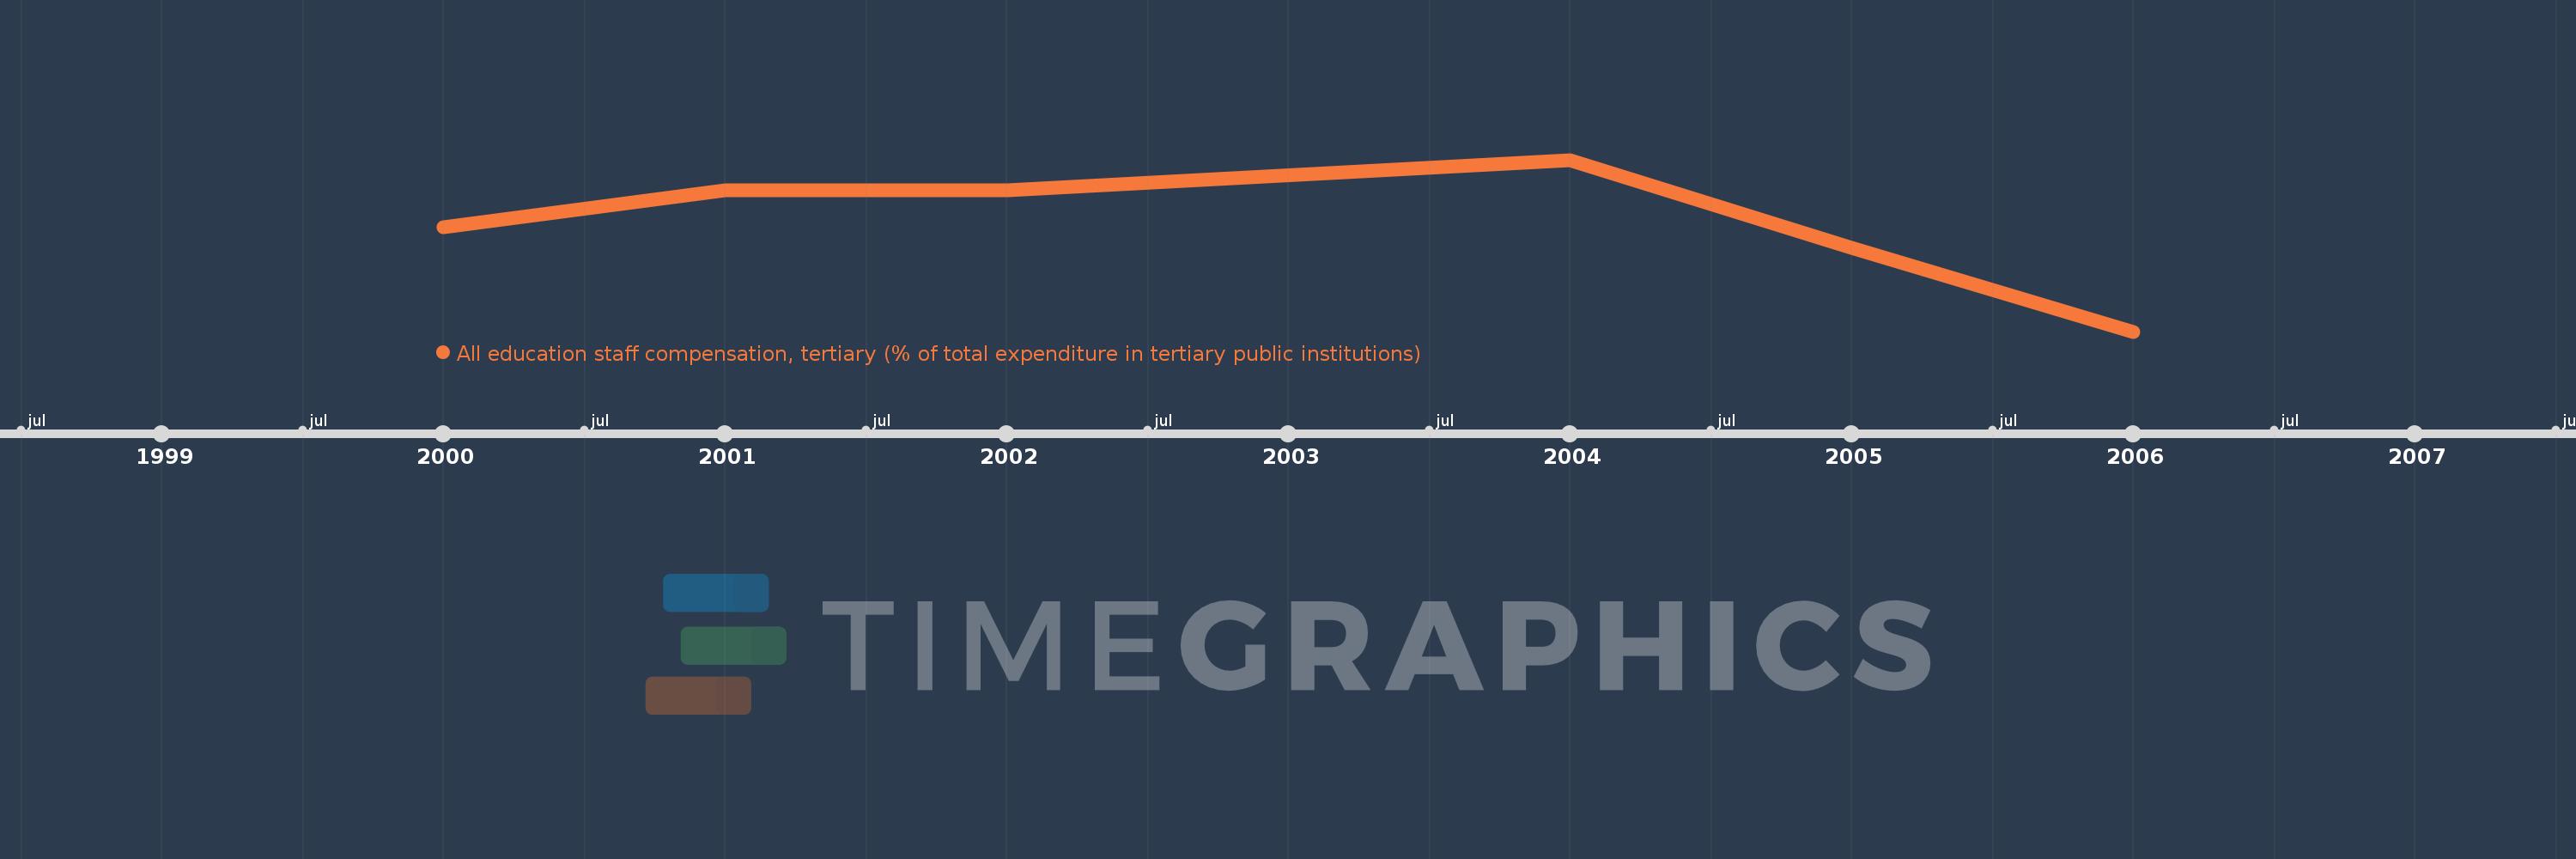
Questa scala temporale mostra un grafico dal 2000 anno al 2006 anno. India. I dati fino ad 1999 anno non disponibili. Il numero di osservazioni attuali secondo i date: 6.
La fonte (nome):
Indicatori dello sviluppo mondiale
La fonte (organizzazione):
United Nations Educational, Scientific, and Cultural Organization (UNESCO) Institute for Statistics.
Categorie:
Education
sono stati aggiornati
23 apr 2017 anni
Indicatori delle variazioni dei valori per anni
Minima:
97.329
1 gen 2006 anni
Massimo:
98.789
1 gen 2004 anni
Alla data di osservazione
Valore
Variazione assoluta
La variazione rispetto al valore precedente
1 gen 2000 anni
98.214
+98.214
0.0%
1 gen 2001 anni
98.53
+0.316
0.32%
1 gen 2002 anni
98.529
0.0
0.0%
1 gen 2004 anni
98.789
+0.259
0.26%
1 gen 2005 anni
98.043
-0.746
-0.76%
1 gen 2006 anni
97.329
-0.713
-0.73%
Classificazione dei paesi secondo i statistiche attuali per anni