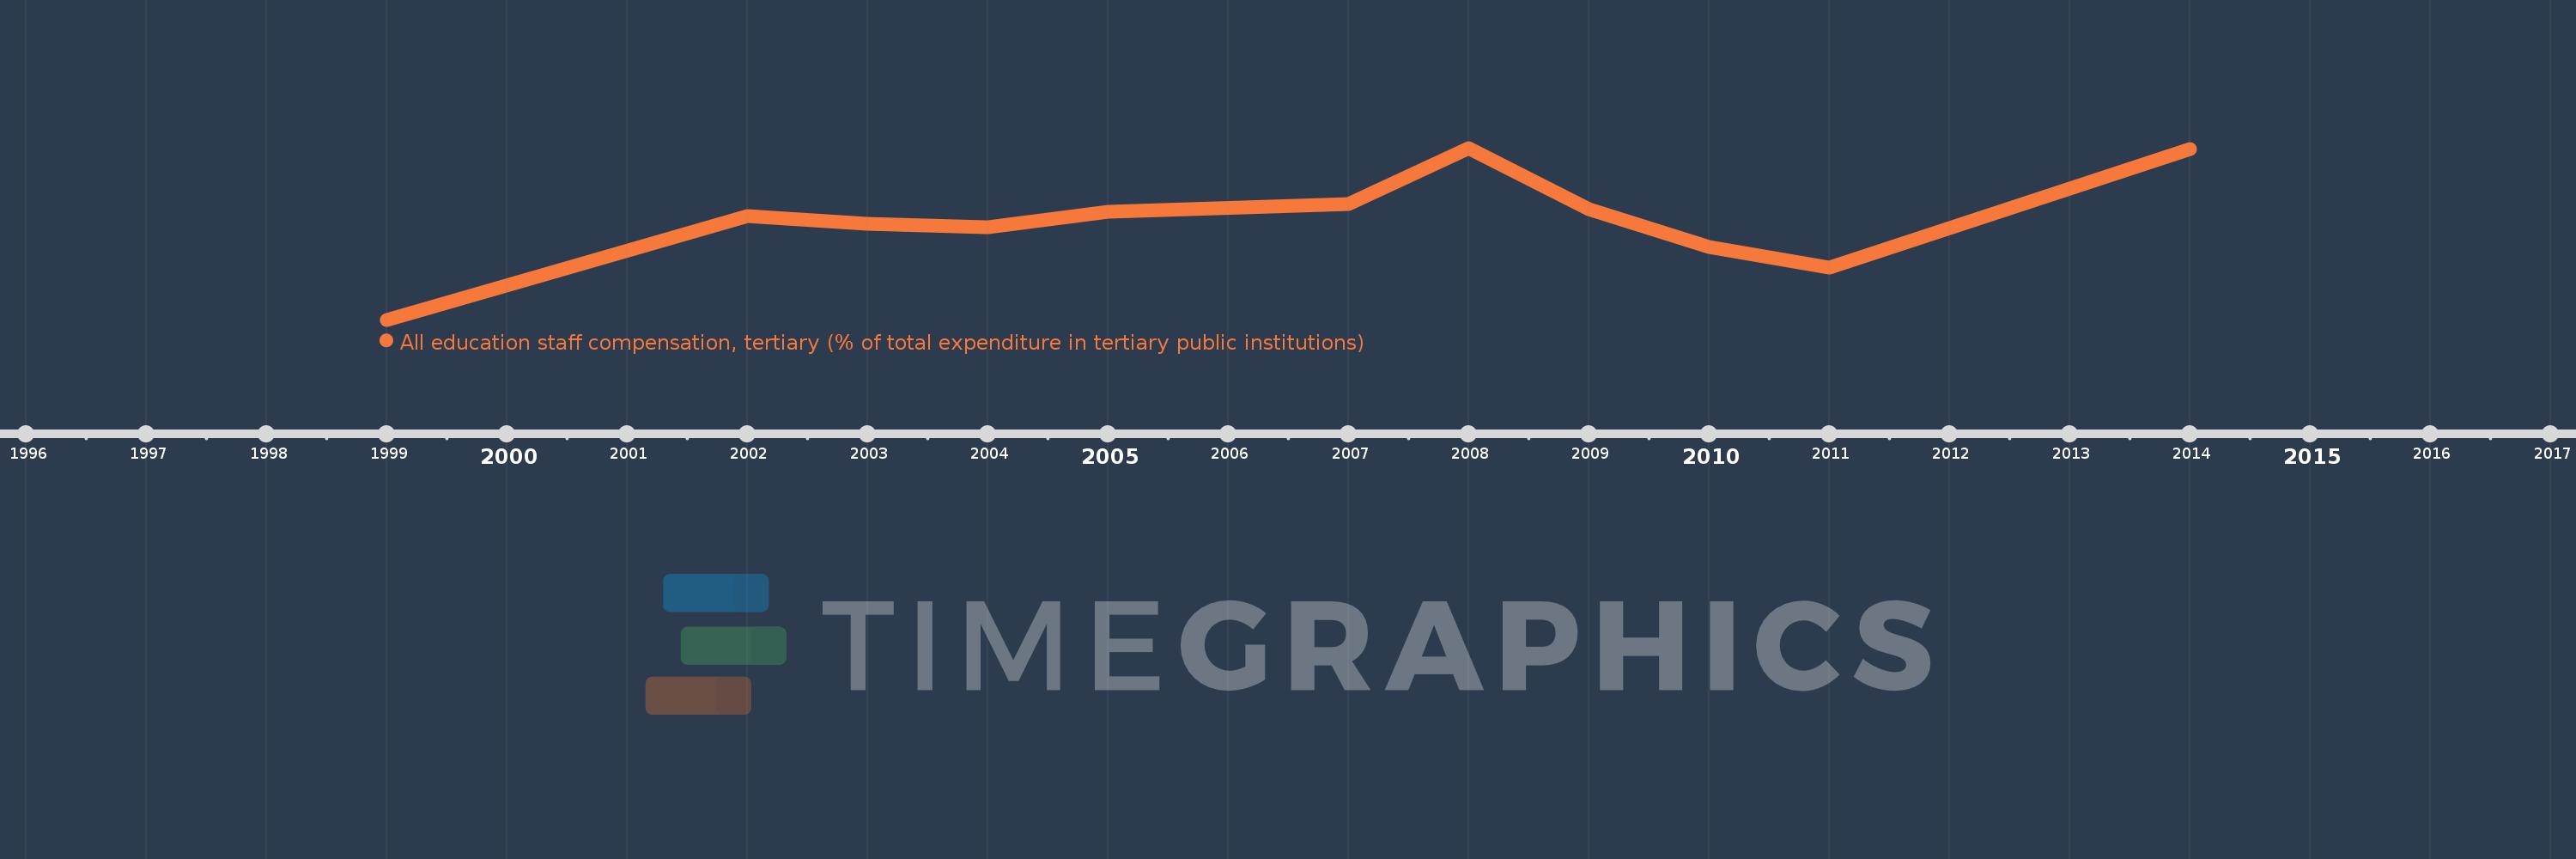
Questa scala temporale mostra un grafico dal 1999 anno al 2014 anno. Argentina. I dati fino ad 1998 anno non disponibili. Il numero di osservazioni attuali secondo i date: 11.
La fonte (nome):
Indicatori dello sviluppo mondiale
La fonte (organizzazione):
United Nations Educational, Scientific, and Cultural Organization (UNESCO) Institute for Statistics.
Categorie:
Education
sono stati aggiornati
23 apr 2017 anni
Indicatori delle variazioni dei valori per anni
In media:
88.723
Minima:
80.316
1 gen 1999 anni
Massimo:
94.853
1 gen 2008 anni
Alla data di osservazione
Valore
Variazione assoluta
La variazione rispetto al valore precedente
1 gen 1999 anni
80.316
+80.316
0.0%
1 gen 2002 anni
89.079
+8.763
10.91%
1 gen 2003 anni
88.436
-0.643
-0.72%
1 gen 2004 anni
88.158
-0.278
-0.31%
1 gen 2005 anni
89.467
+1.309
1.48%
1 gen 2007 anni
90.086
+0.619
0.69%
1 gen 2008 anni
94.853
+4.767
5.29%
1 gen 2009 anni
89.641
-5.212
-5.49%
1 gen 2010 anni
86.499
-3.142
-3.51%
1 gen 2011 anni
84.697
-1.801
-2.08%
1 gen 2014 anni
94.725
+10.027
11.84%
Classificazione dei paesi secondo i statistiche attuali per anni