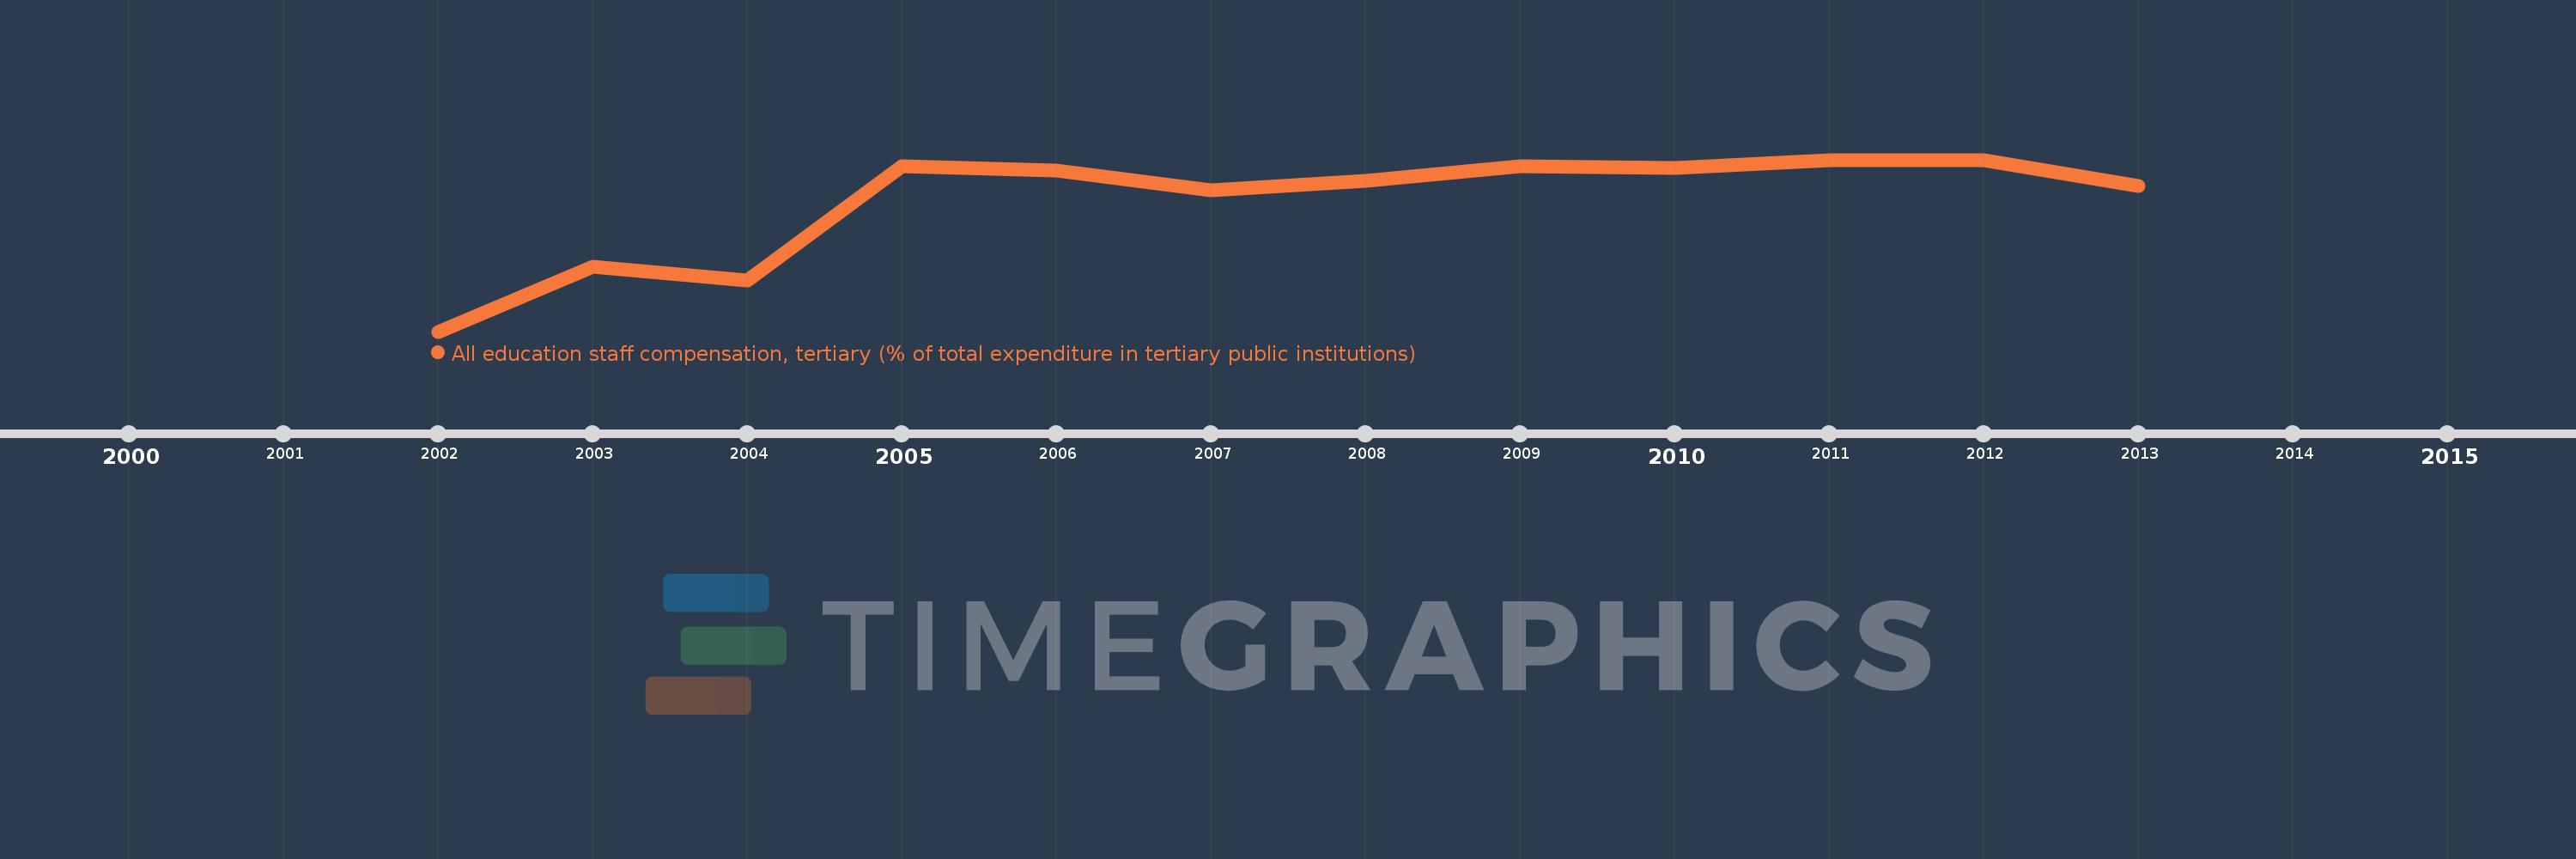
Questa scala temporale mostra un grafico dal 2002 anno al 2013 anno. Belgium. I dati fino ad 2001 anno non disponibili. Il numero di osservazioni attuali secondo i date: 12.
La fonte (nome):
Indicatori dello sviluppo mondiale
La fonte (organizzazione):
United Nations Educational, Scientific, and Cultural Organization (UNESCO) Institute for Statistics.
Categorie:
Education
sono stati aggiornati
23 apr 2017 anni
Indicatori delle variazioni dei valori per anni
In media:
74.613
Minima:
66.016
1 gen 2002 anni
Massimo:
77.43
1 gen 2012 anni
Alla data di osservazione
Valore
Variazione assoluta
La variazione rispetto al valore precedente
1 gen 2002 anni
66.016
+66.016
0.0%
1 gen 2003 anni
70.343
+4.328
6.56%
1 gen 2004 anni
69.425
-0.918
-1.31%
1 gen 2005 anni
77.025
+7.6
10.95%
1 gen 2006 anni
76.706
-0.319
-0.41%
1 gen 2007 anni
75.395
-1.311
-1.71%
1 gen 2008 anni
76.049
+0.655
0.87%
1 gen 2009 anni
77.025
+0.976
1.28%
1 gen 2010 anni
76.863
-0.162
-0.21%
1 gen 2011 anni
77.378
+0.515
0.67%
1 gen 2012 anni
77.43
+0.052
0.07%
1 gen 2013 anni
75.705
-1.725
-2.23%
Classificazione dei paesi secondo i statistiche attuali per anni