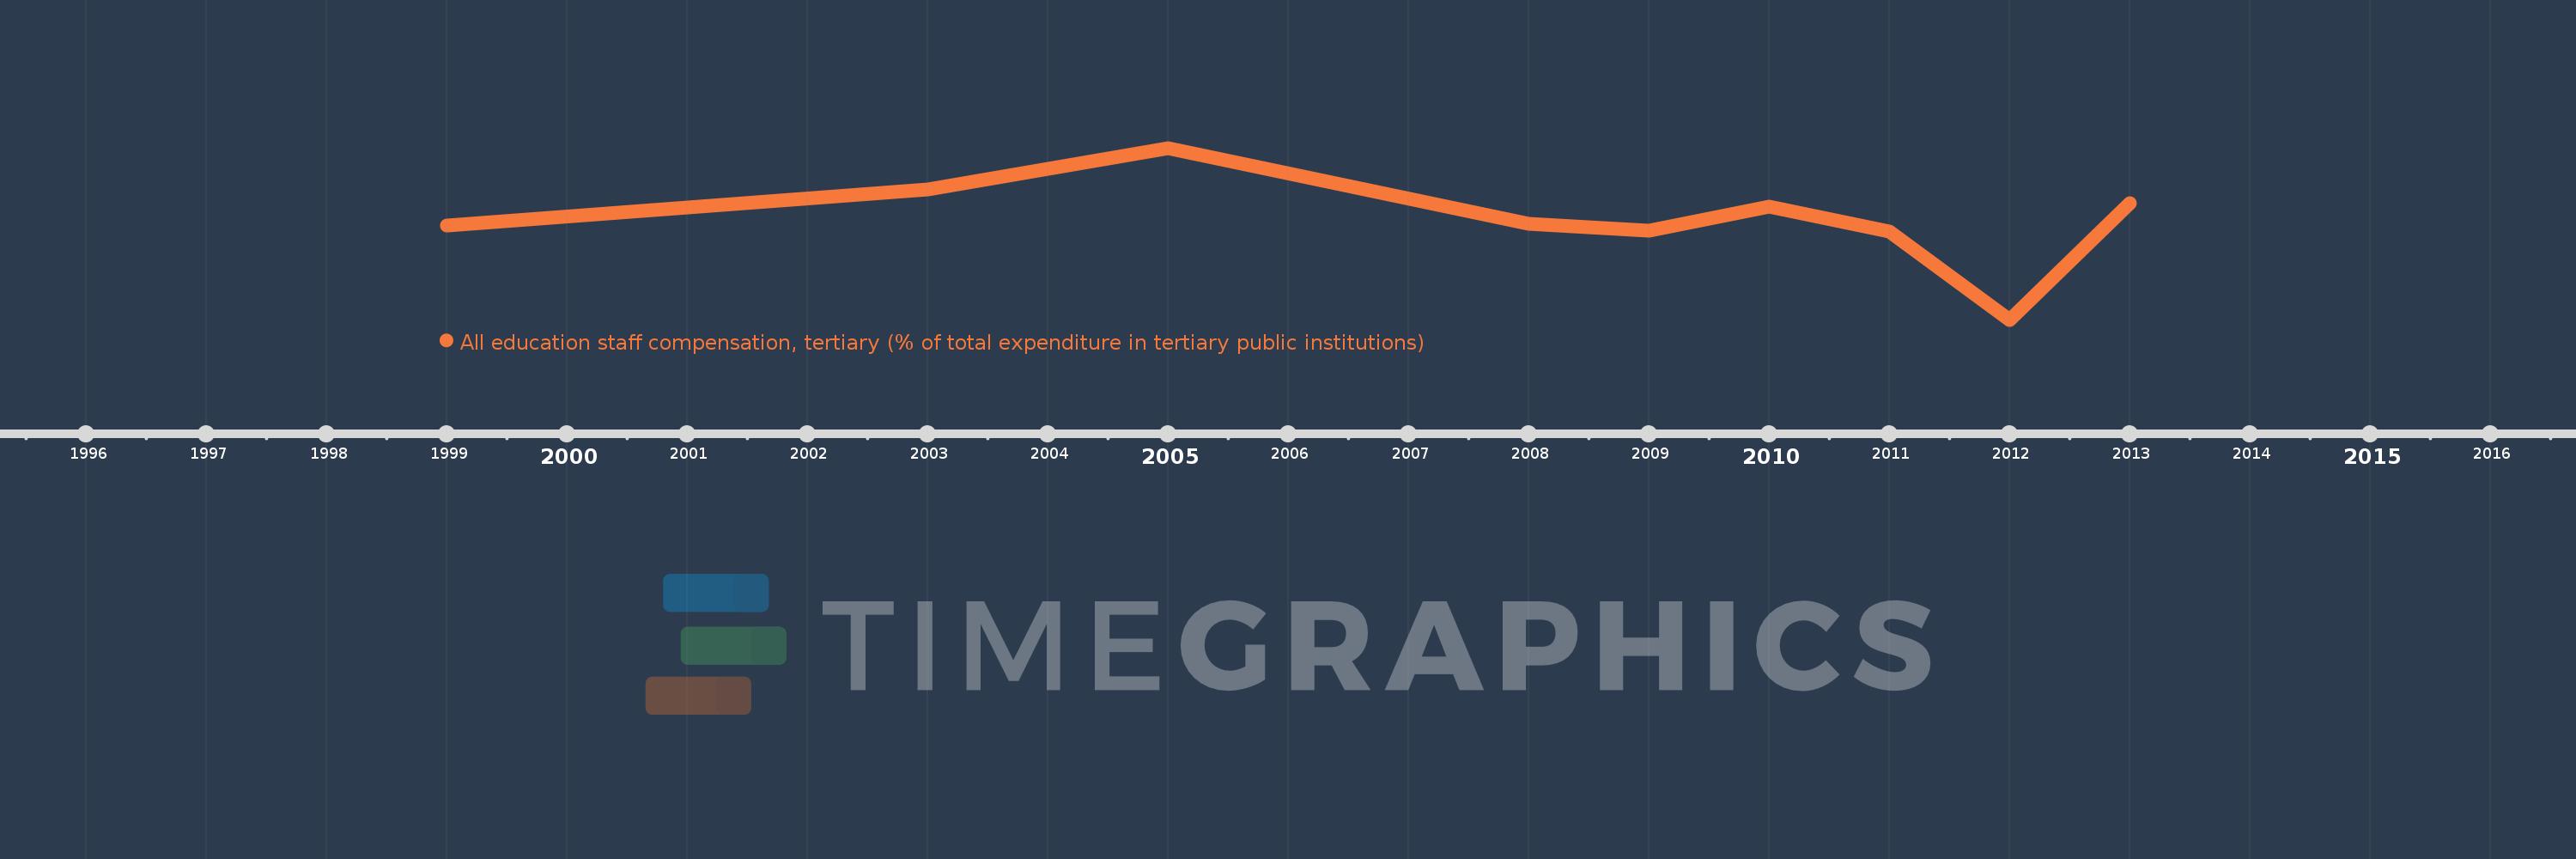
Questa scala temporale mostra un grafico dal 1999 anno al 2013 anno. Malta. I dati fino ad 1998 anno non disponibili. Il numero di osservazioni attuali secondo i date: 9.
La fonte (nome):
Indicatori dello sviluppo mondiale
La fonte (organizzazione):
United Nations Educational, Scientific, and Cultural Organization (UNESCO) Institute for Statistics.
Categorie:
Education
sono stati aggiornati
23 apr 2017 anni
Indicatori delle variazioni dei valori per anni
In media:
52.857
Minima:
31.414
1 gen 2012 anni
Massimo:
68.289
1 gen 2005 anni
Alla data di osservazione
Valore
Variazione assoluta
La variazione rispetto al valore precedente
1 gen 1999 anni
51.657
+51.657
0.0%
1 gen 2003 anni
59.355
+7.699
14.9%
1 gen 2005 anni
68.289
+8.934
15.05%
1 gen 2008 anni
52.092
-16.197
-23.72%
1 gen 2009 anni
50.483
-1.609
-3.09%
1 gen 2010 anni
55.625
+5.141
10.18%
1 gen 2011 anni
50.377
-5.247
-9.43%
1 gen 2012 anni
31.414
-18.963
-37.64%
1 gen 2013 anni
56.417
+25.003
79.59%
Classificazione dei paesi secondo i statistiche attuali per anni