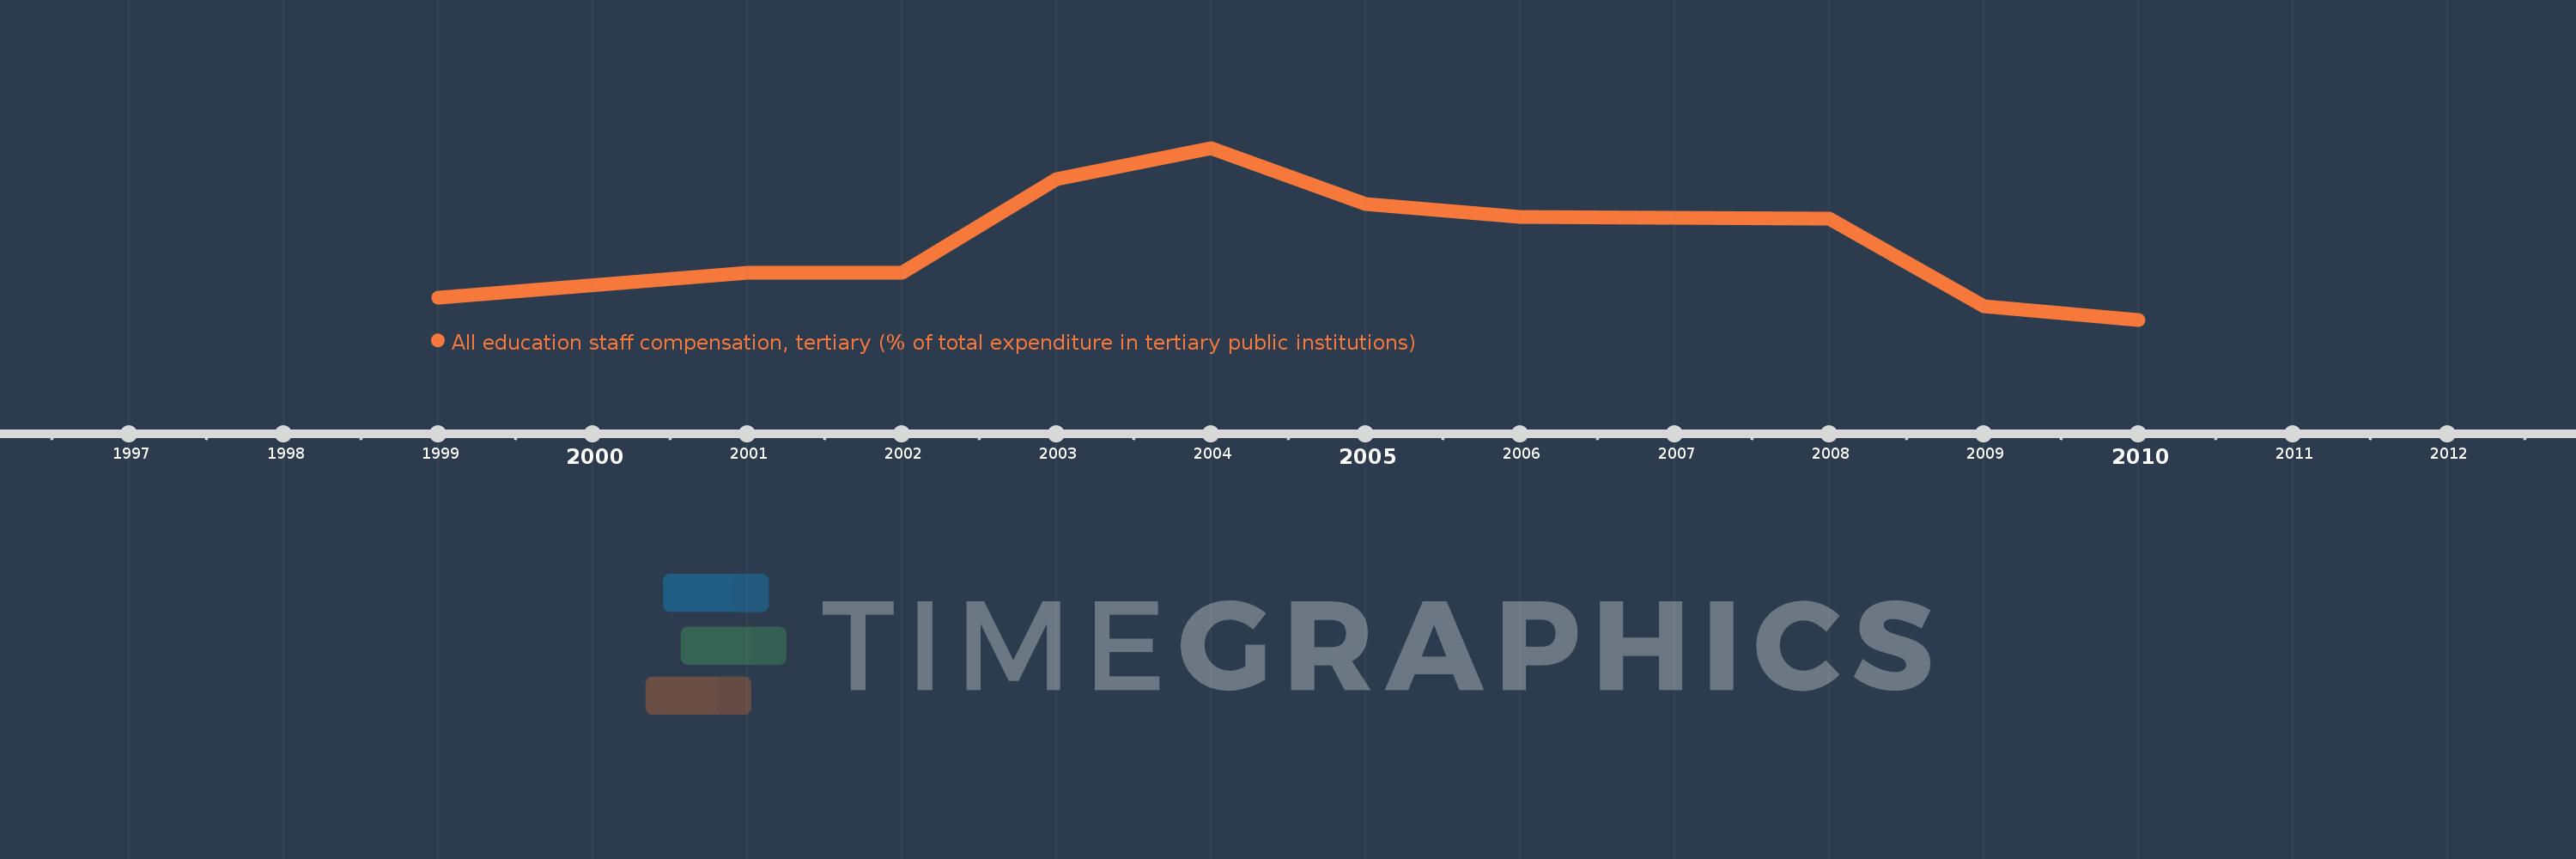
Questa scala temporale mostra un grafico dal 1999 anno al 2010 anno. Philippines. I dati fino ad 1998 anno non disponibili. Il numero di osservazioni attuali secondo i date: 10.
La fonte (nome):
Indicatori dello sviluppo mondiale
La fonte (organizzazione):
United Nations Educational, Scientific, and Cultural Organization (UNESCO) Institute for Statistics.
Categorie:
Education
sono stati aggiornati
23 apr 2017 anni
Indicatori delle variazioni dei valori per anni
In media:
74.888
Minima:
66.876
1 gen 2010 anni
Massimo:
84.954
1 gen 2004 anni
Alla data di osservazione
Valore
Variazione assoluta
La variazione rispetto al valore precedente
1 gen 1999 anni
69.221
+69.221
0.0%
1 gen 2001 anni
71.792
+2.571
3.71%
1 gen 2002 anni
71.792
0.0
0.0%
1 gen 2003 anni
81.701
+9.909
13.8%
1 gen 2004 anni
84.954
+3.253
3.98%
1 gen 2005 anni
79.013
-5.941
-6.99%
1 gen 2006 anni
77.729
-1.284
-1.63%
1 gen 2008 anni
77.498
-0.231
-0.3%
1 gen 2009 anni
68.307
-9.191
-11.86%
1 gen 2010 anni
66.876
-1.432
-2.1%
Classificazione dei paesi secondo i statistiche attuali per anni