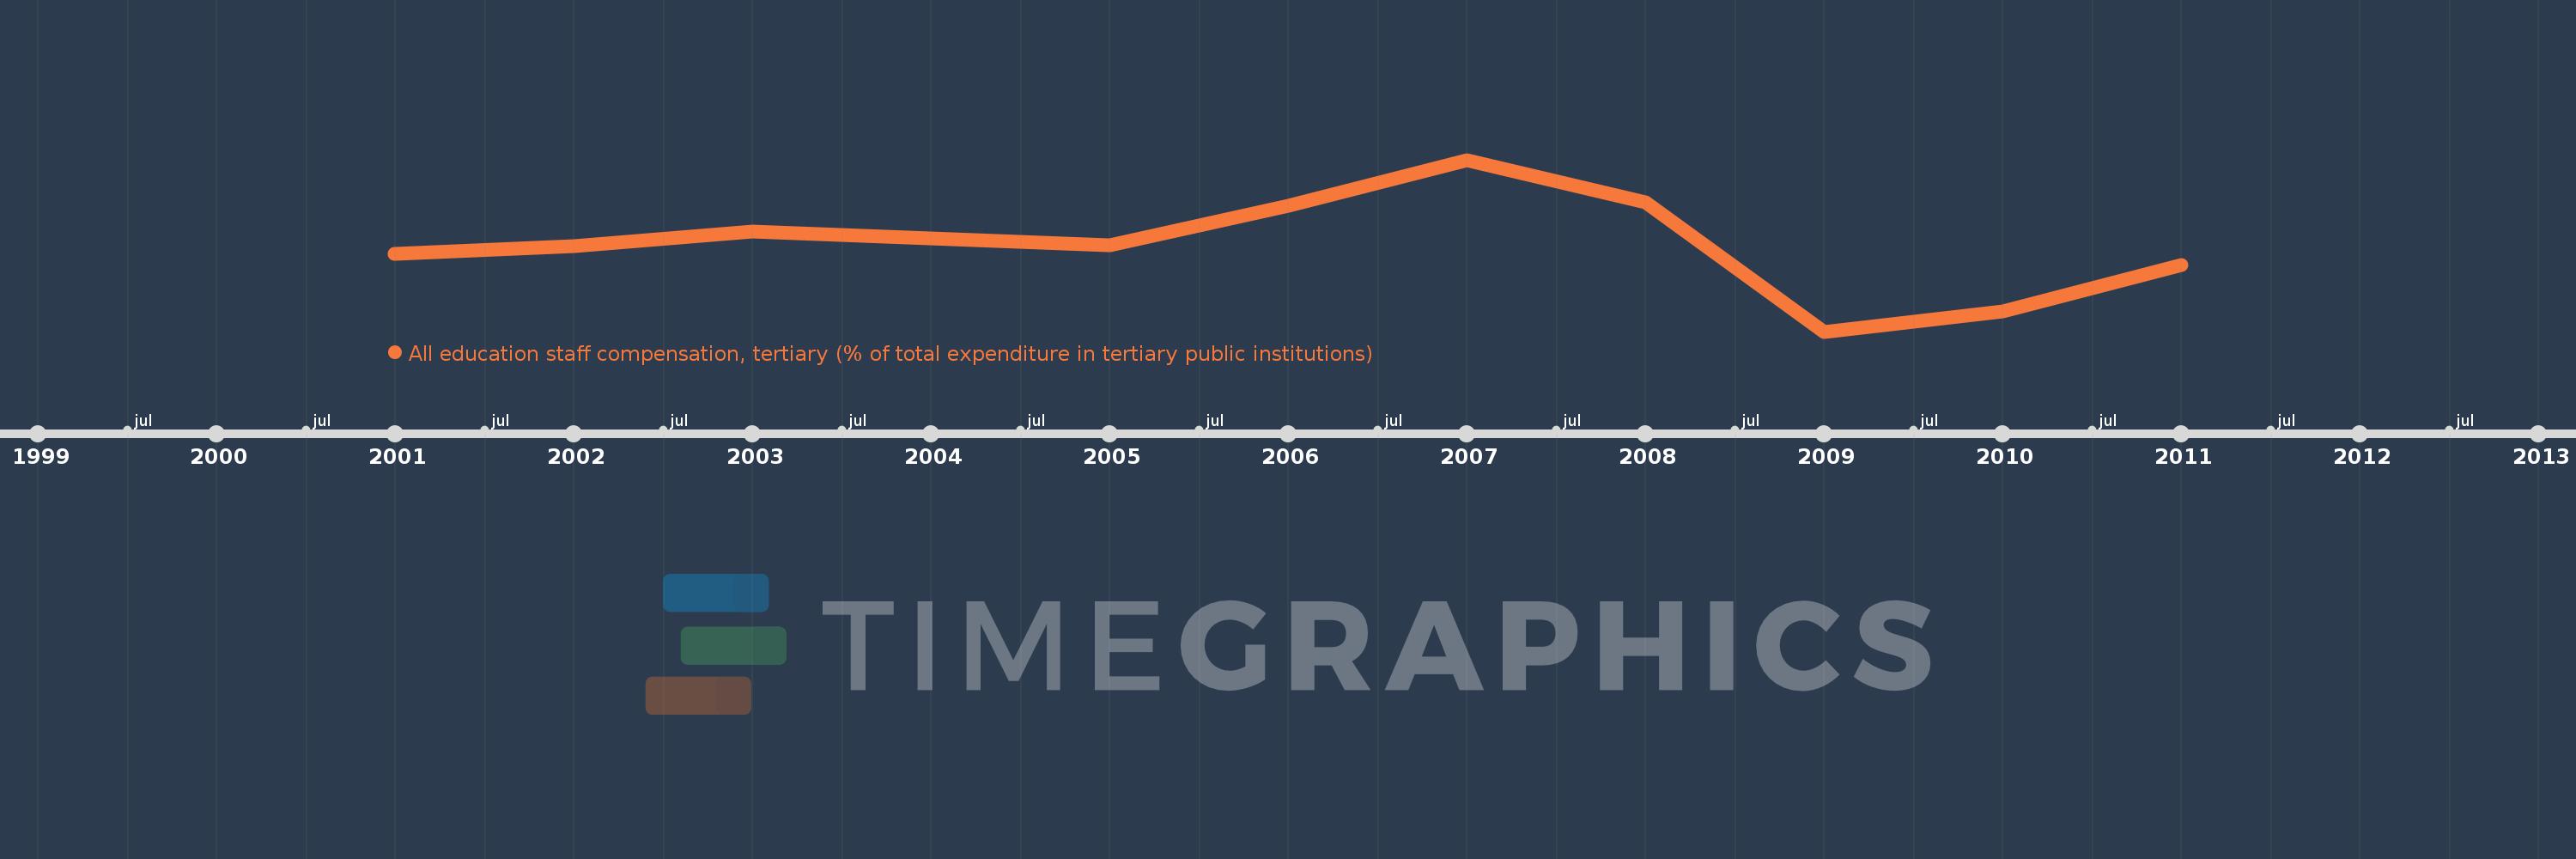
Questa scala temporale mostra un grafico dal 2001 anno al 2011 anno. Cuba. I dati fino ad 2000 anno non disponibili. Il numero di osservazioni attuali secondo i date: 10.
La fonte (nome):
Indicatori dello sviluppo mondiale
La fonte (organizzazione):
United Nations Educational, Scientific, and Cultural Organization (UNESCO) Institute for Statistics.
Categorie:
Education
sono stati aggiornati
23 apr 2017 anni
Indicatori delle variazioni dei valori per anni
In media:
37.716
Minima:
25.621
1 gen 2009 anni
Massimo:
49.722
1 gen 2007 anni
Alla data di osservazione
Valore
Variazione assoluta
La variazione rispetto al valore precedente
1 gen 2001 anni
36.531
+36.531
0.0%
1 gen 2002 anni
37.577
+1.046
2.86%
1 gen 2003 anni
39.636
+2.059
5.48%
1 gen 2005 anni
37.726
-1.911
-4.82%
1 gen 2006 anni
43.225
+5.499
14.58%
1 gen 2007 anni
49.722
+6.497
15.03%
1 gen 2008 anni
43.741
-5.981
-12.03%
1 gen 2009 anni
25.621
-18.12
-41.43%
1 gen 2010 anni
28.464
+2.843
11.1%
1 gen 2011 anni
34.913
+6.449
22.66%
Classificazione dei paesi secondo i statistiche attuali per anni