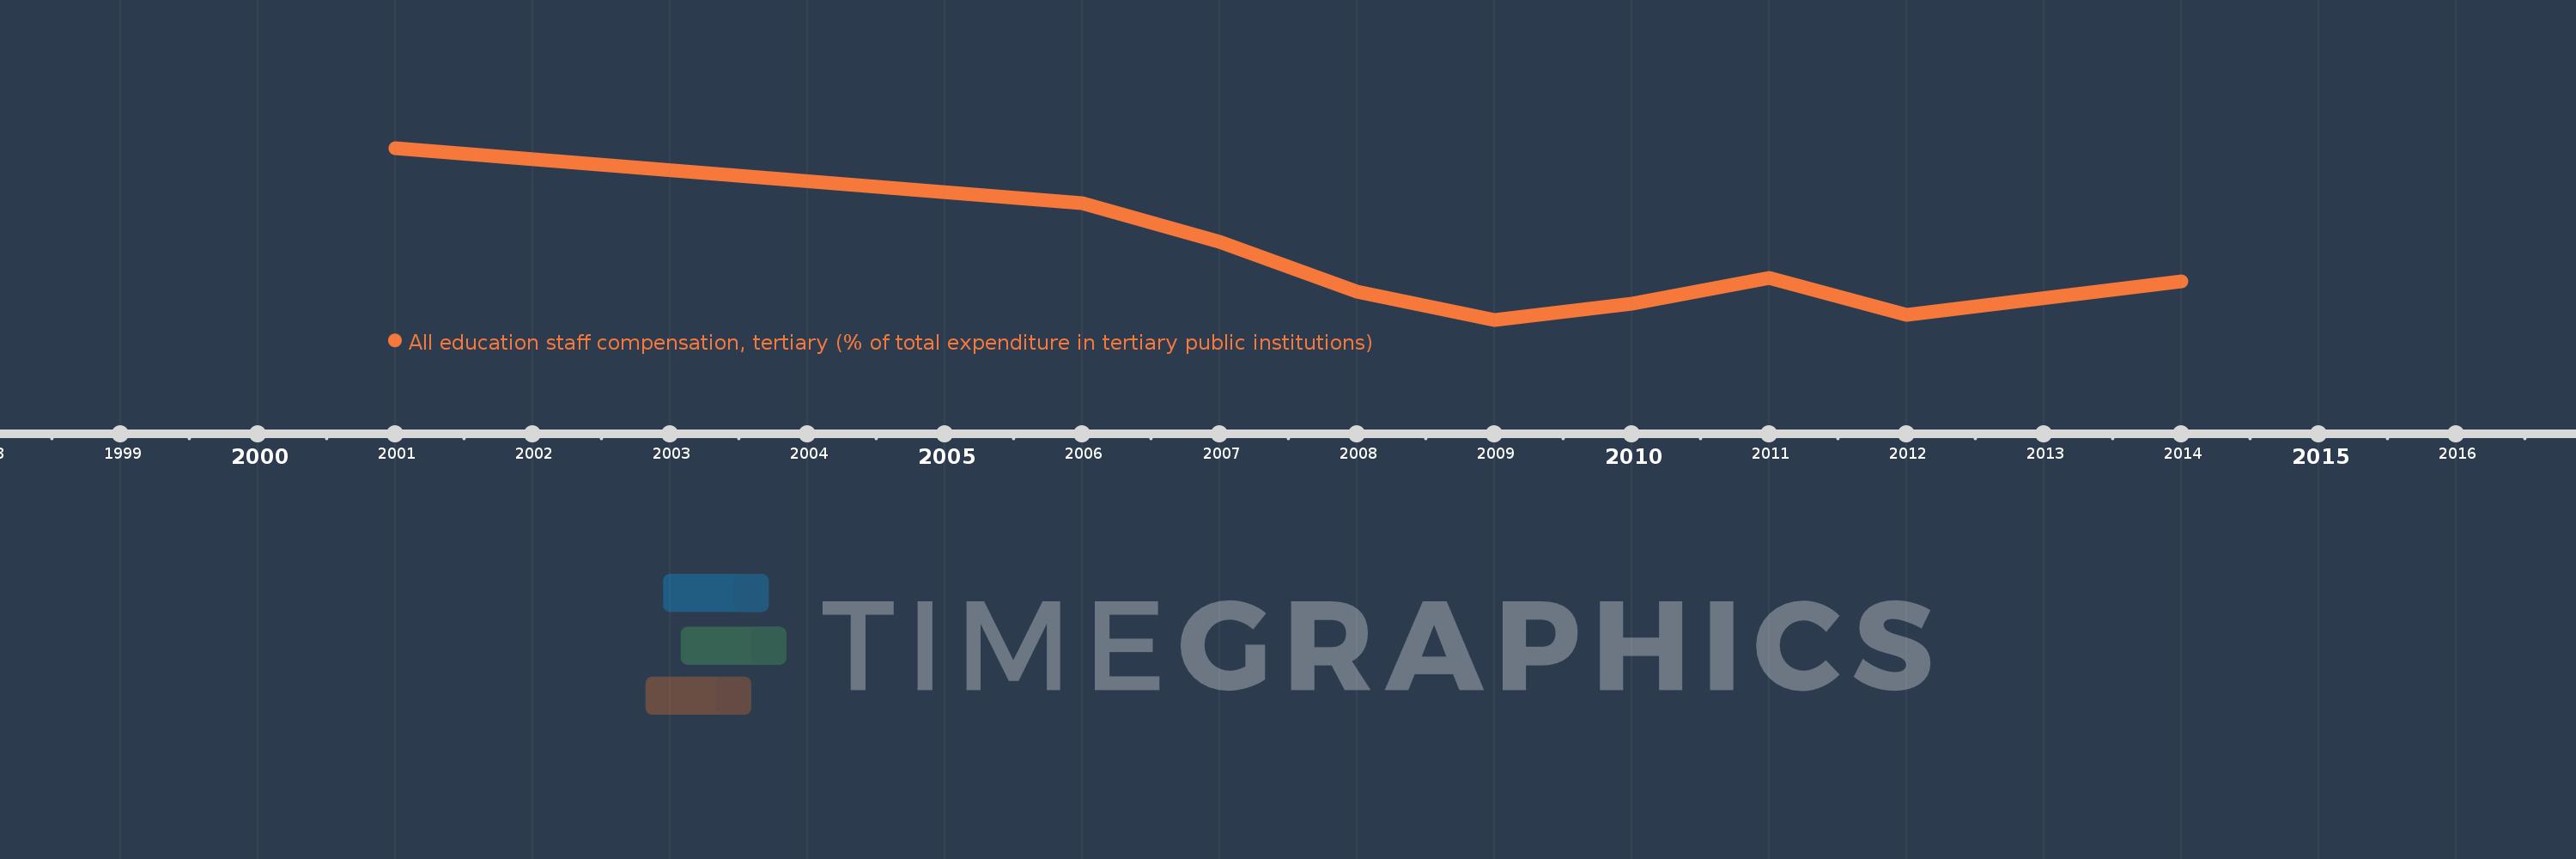
Questa scala temporale mostra un grafico dal 2001 anno al 2014 anno. Australia. I dati fino ad 2000 anno non disponibili. Il numero di osservazioni attuali secondo i date: 9.
La fonte (nome):
Indicatori dello sviluppo mondiale
La fonte (organizzazione):
United Nations Educational, Scientific, and Cultural Organization (UNESCO) Institute for Statistics.
Categorie:
Education
sono stati aggiornati
23 apr 2017 anni
Indicatori delle variazioni dei valori per anni
In media:
54.656
Minima:
53.125
1 gen 2009 anni
Massimo:
57.895
1 gen 2001 anni
Alla data di osservazione
Valore
Variazione assoluta
La variazione rispetto al valore precedente
1 gen 2001 anni
57.895
+57.895
0.0%
1 gen 2006 anni
56.367
-1.529
-2.64%
1 gen 2007 anni
55.284
-1.083
-1.92%
1 gen 2008 anni
53.915
-1.369
-2.48%
1 gen 2009 anni
53.125
-0.79
-1.47%
1 gen 2010 anni
53.579
+0.454
0.86%
1 gen 2011 anni
54.293
+0.715
1.33%
1 gen 2012 anni
53.25
-1.044
-1.92%
1 gen 2014 anni
54.194
+0.944
1.77%
Classificazione dei paesi secondo i statistiche attuali per anni