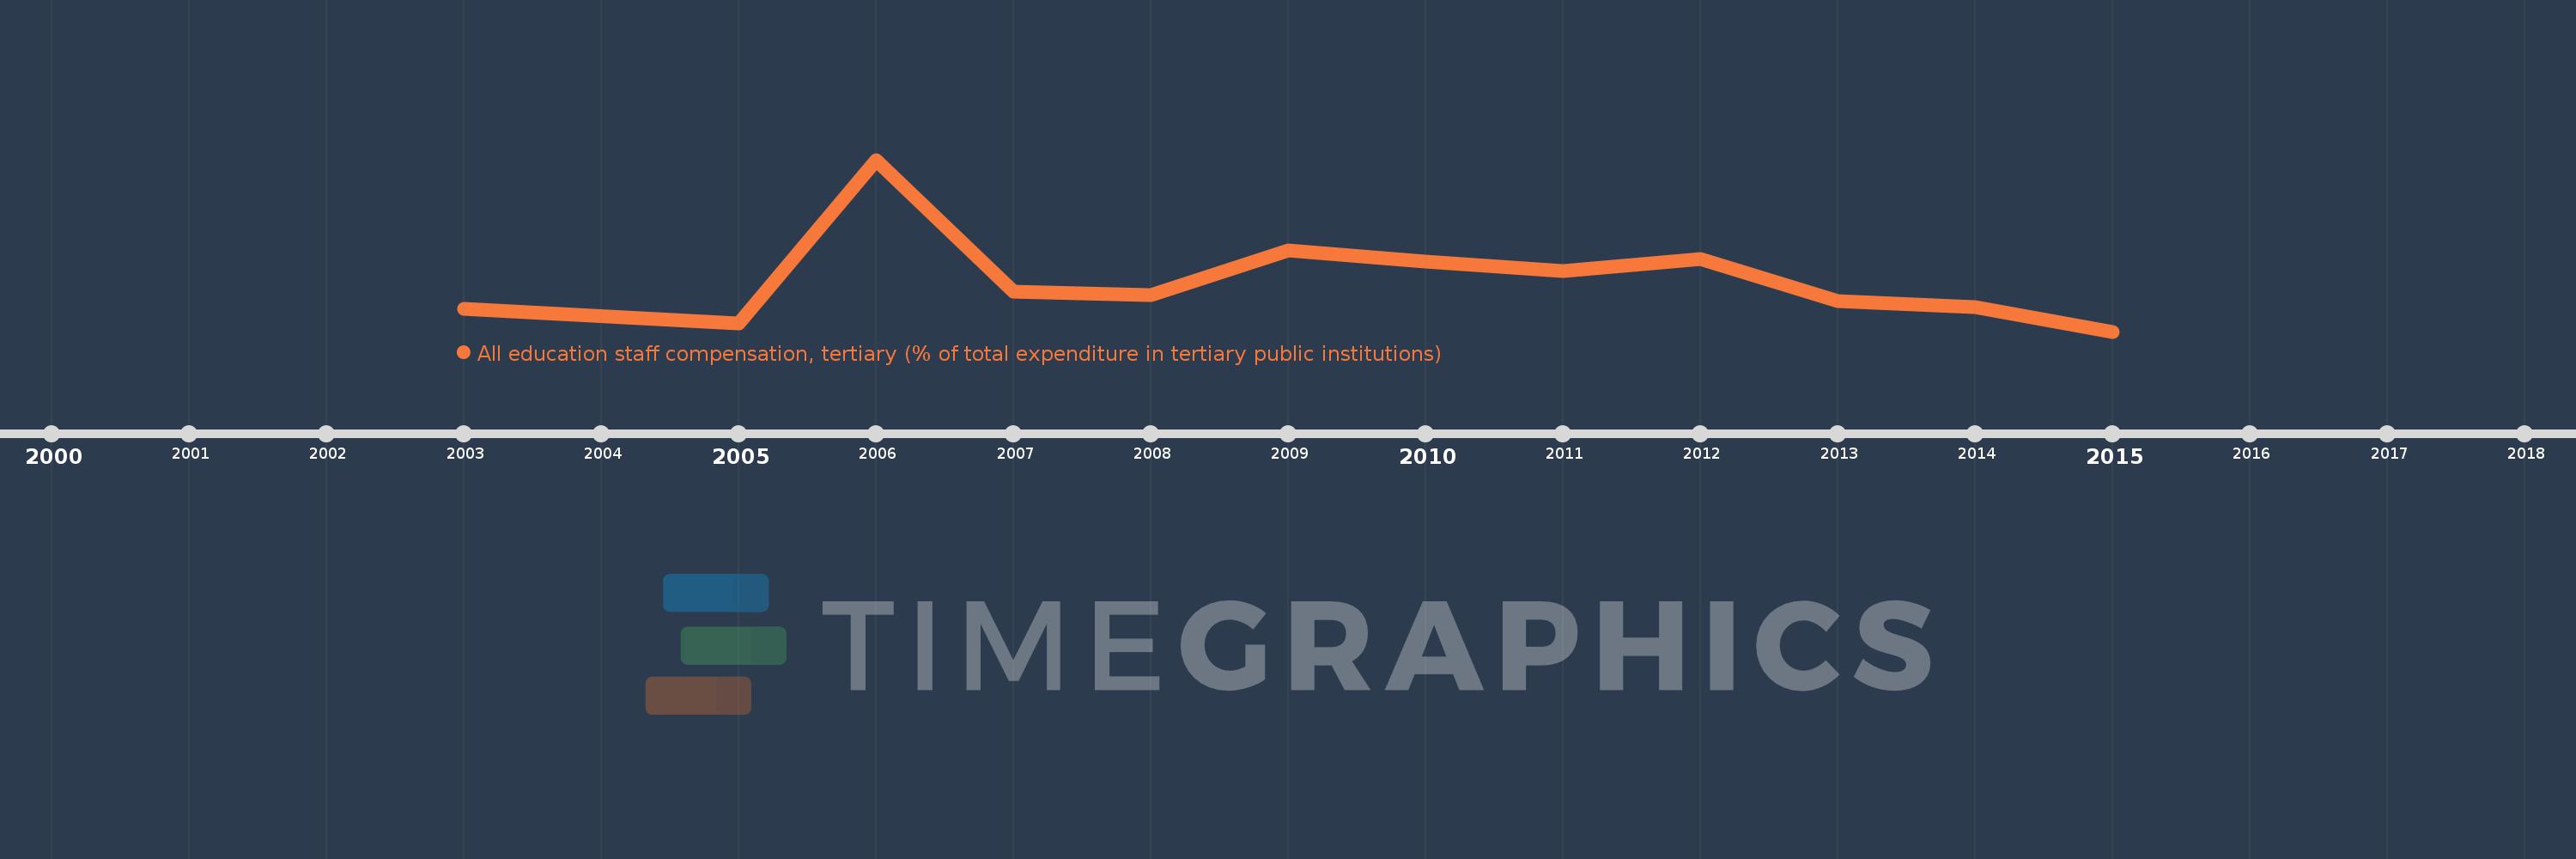
Questa scala temporale mostra un grafico dal 2003 anno al 2015 anno. Kazakhstan. I dati fino ad 2002 anno non disponibili. Il numero di osservazioni attuali secondo i date: 12.
La fonte (nome):
Indicatori dello sviluppo mondiale
La fonte (organizzazione):
United Nations Educational, Scientific, and Cultural Organization (UNESCO) Institute for Statistics.
Categorie:
Education
sono stati aggiornati
23 apr 2017 anni
Indicatori delle variazioni dei valori per anni
In media:
42.691
Minima:
37.824
1 gen 2015 anni
Massimo:
54.049
1 gen 2006 anni
Alla data di osservazione
Valore
Variazione assoluta
La variazione rispetto al valore precedente
1 gen 2003 anni
39.965
+39.965
0.0%
1 gen 2005 anni
38.588
-1.377
-3.45%
1 gen 2006 anni
54.049
+15.461
40.07%
1 gen 2007 anni
41.567
-12.482
-23.09%
1 gen 2008 anni
41.266
-0.301
-0.72%
1 gen 2009 anni
45.483
+4.217
10.22%
1 gen 2010 anni
44.476
-1.007
-2.21%
1 gen 2011 anni
43.525
-0.951
-2.14%
1 gen 2012 anni
44.648
+1.123
2.58%
1 gen 2013 anni
40.735
-3.913
-8.76%
1 gen 2014 anni
40.167
-0.568
-1.4%
1 gen 2015 anni
37.824
-2.343
-5.83%
Classificazione dei paesi secondo i statistiche attuali per anni