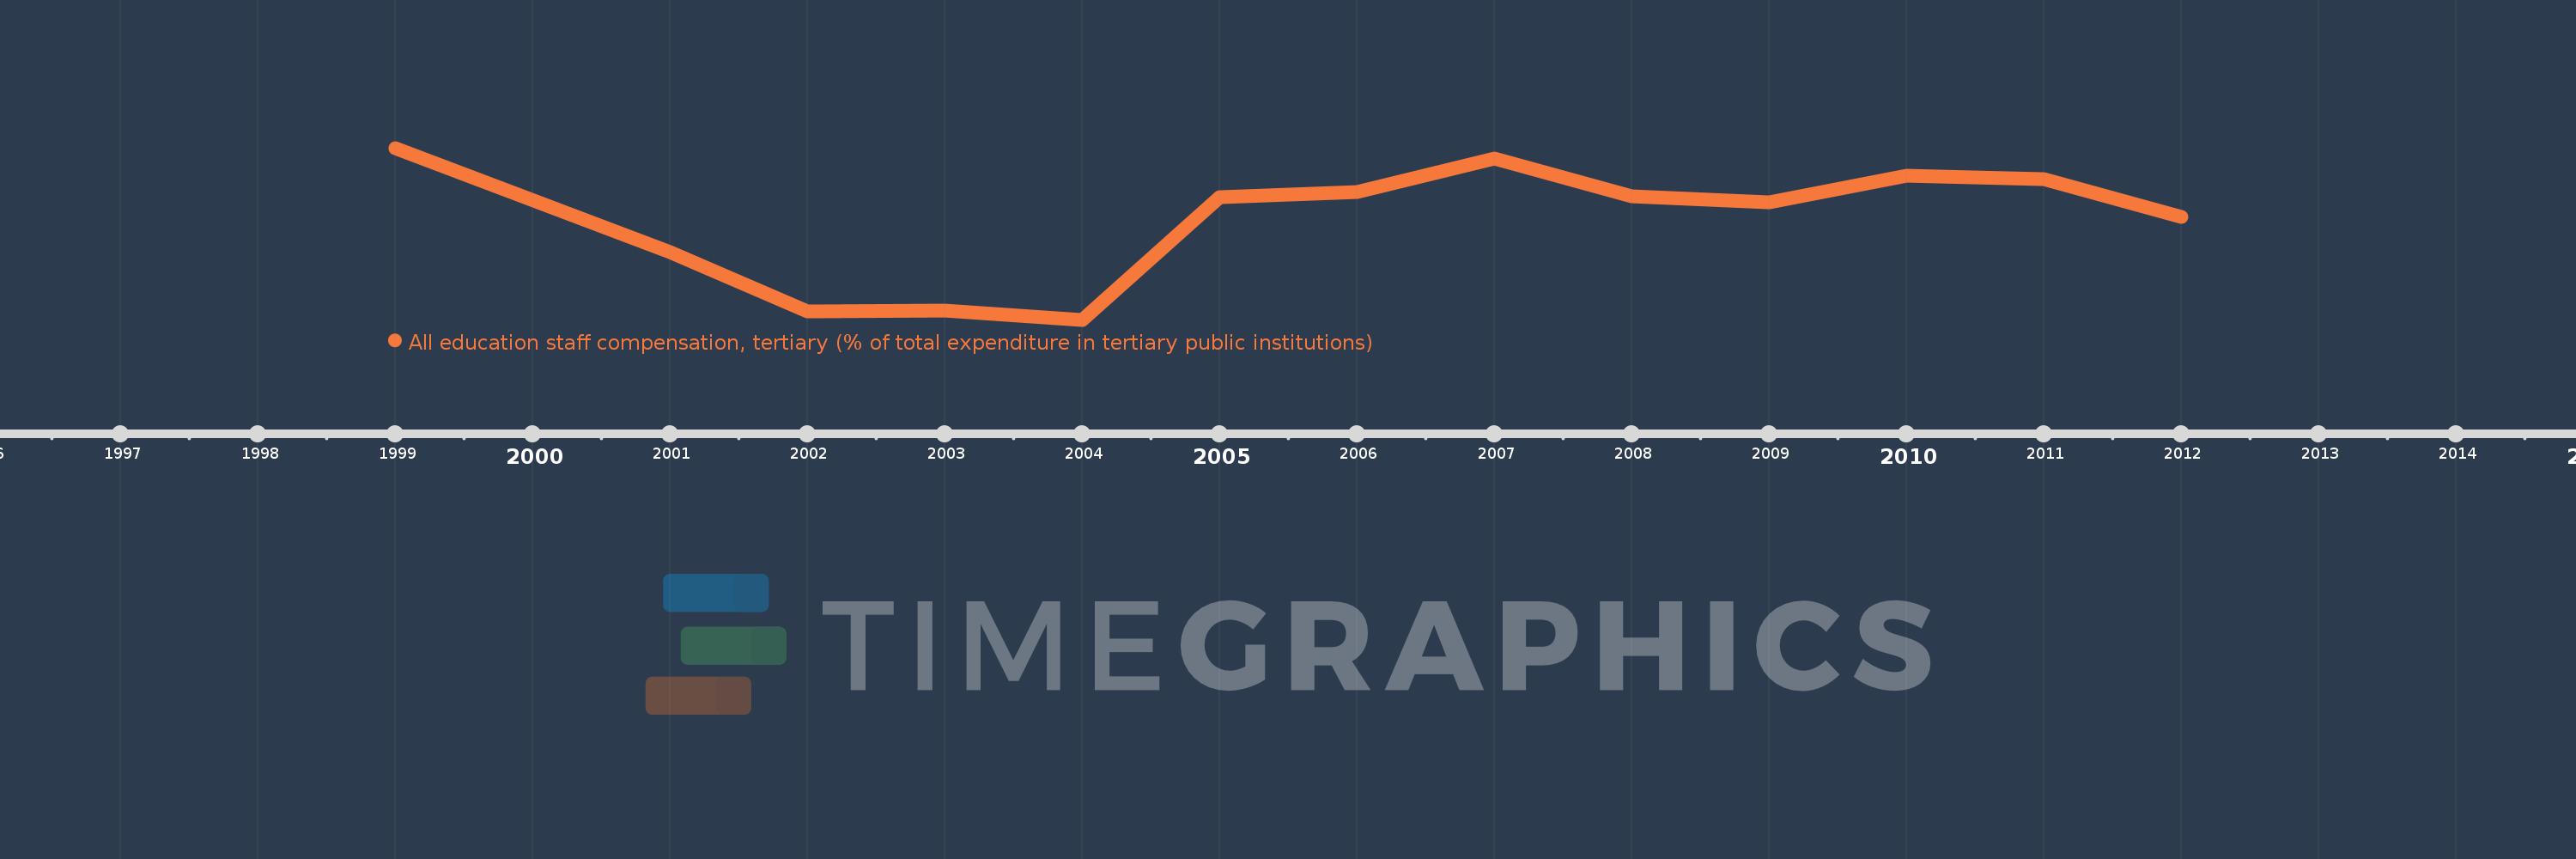
Questa scala temporale mostra un grafico dal 1999 anno al 2012 anno. Italy. I dati fino ad 1998 anno non disponibili. Il numero di osservazioni attuali secondo i date: 13.
La fonte (nome):
Indicatori dello sviluppo mondiale
La fonte (organizzazione):
United Nations Educational, Scientific, and Cultural Organization (UNESCO) Institute for Statistics.
Categorie:
Education
sono stati aggiornati
23 apr 2017 anni
Indicatori delle variazioni dei valori per anni
In media:
57.973
Minima:
52.148
1 gen 2004 anni
Massimo:
62.173
1 gen 1999 anni
Alla data di osservazione
Valore
Variazione assoluta
La variazione rispetto al valore precedente
1 gen 1999 anni
62.173
+62.173
0.0%
1 gen 2001 anni
56.08
-6.093
-9.8%
1 gen 2002 anni
52.659
-3.421
-6.1%
1 gen 2003 anni
52.662
+0.002
0.0%
1 gen 2004 anni
52.148
-0.513
-0.97%
1 gen 2005 anni
59.283
+7.135
13.68%
1 gen 2006 anni
59.586
+0.303
0.51%
1 gen 2007 anni
61.565
+1.979
3.32%
1 gen 2008 anni
59.363
-2.202
-3.58%
1 gen 2009 anni
59.017
-0.347
-0.58%
1 gen 2010 anni
60.573
+1.556
2.64%
1 gen 2011 anni
60.373
-0.2
-0.33%
1 gen 2012 anni
58.163
-2.209
-3.66%
Classificazione dei paesi secondo i statistiche attuali per anni