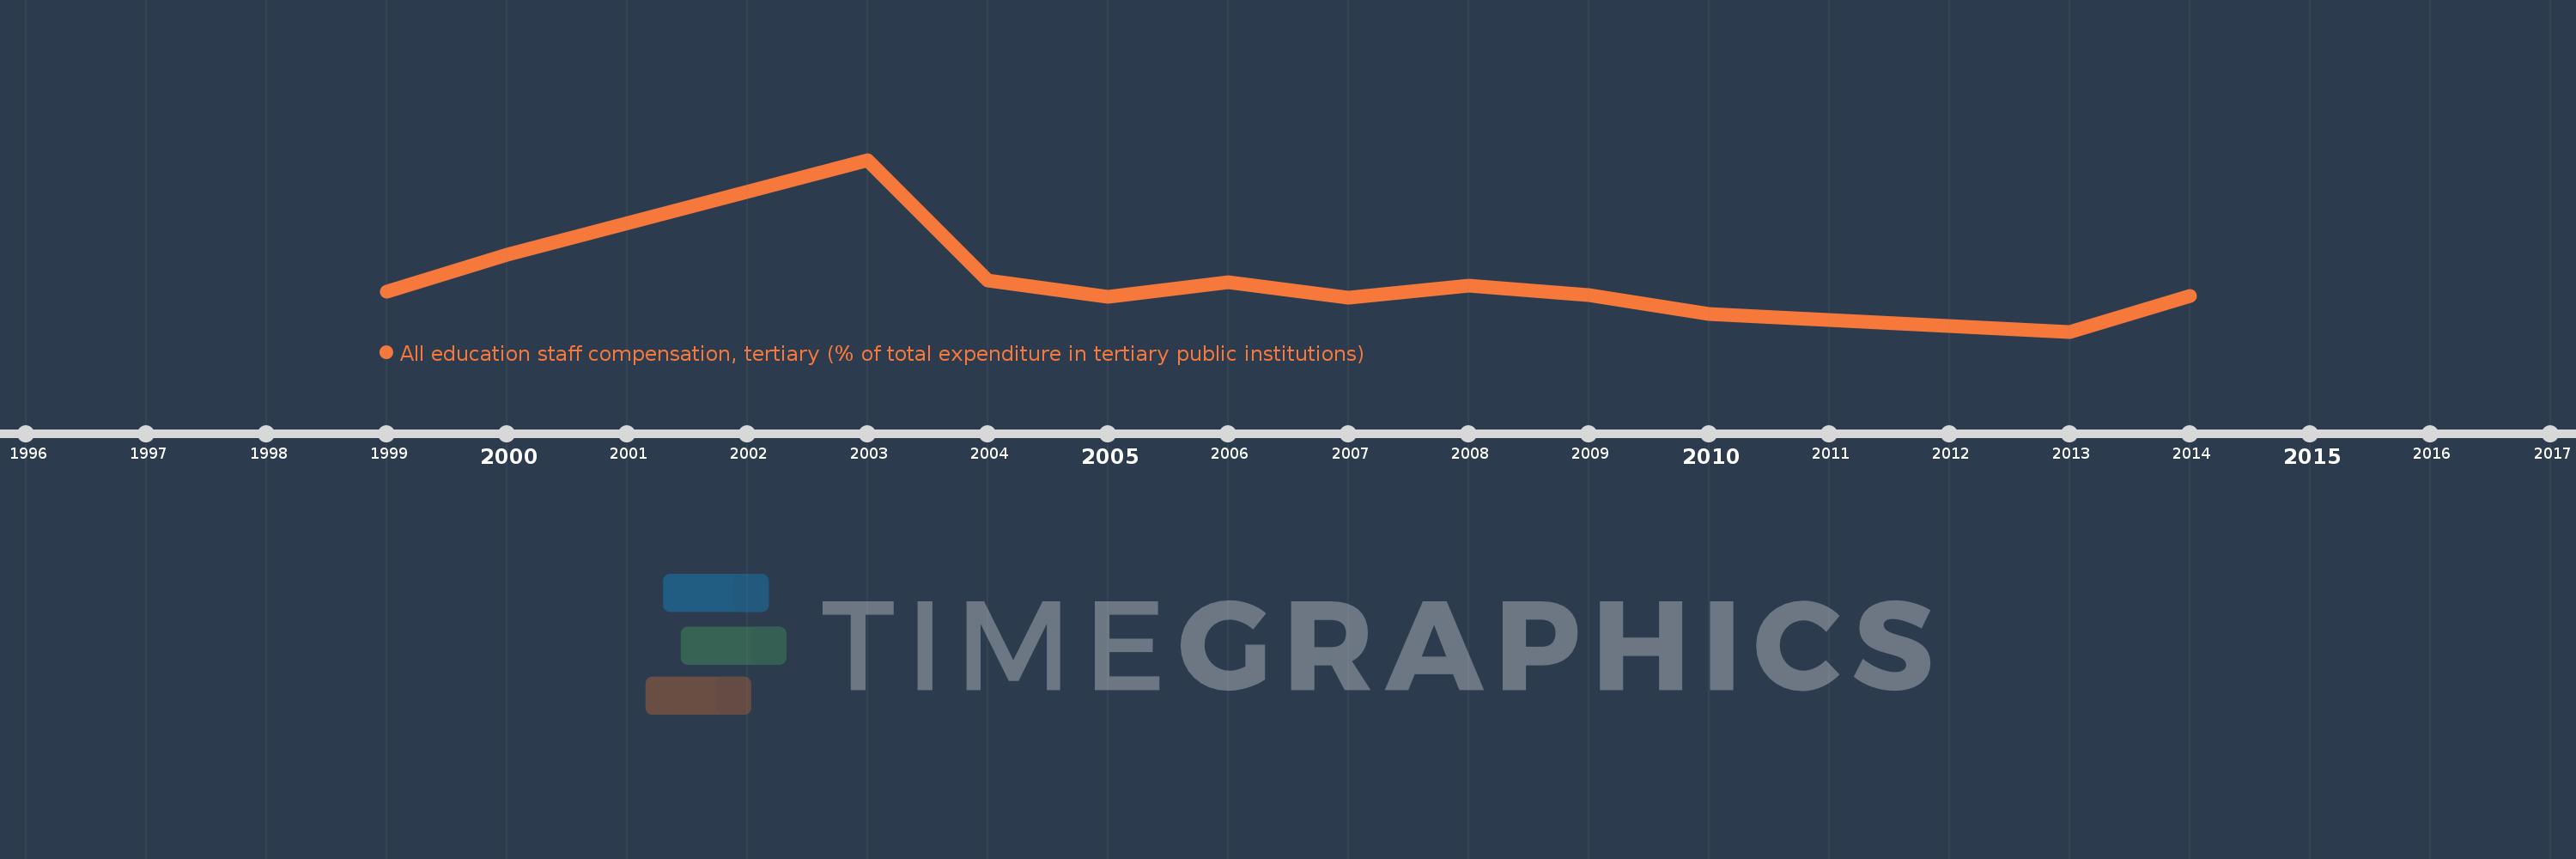
Questa scala temporale mostra un grafico dal 1999 anno al 2014 anno. Korea, Rep.. I dati fino ad 1998 anno non disponibili. Il numero di osservazioni attuali secondo i date: 12.
La fonte (nome):
Indicatori dello sviluppo mondiale
La fonte (organizzazione):
United Nations Educational, Scientific, and Cultural Organization (UNESCO) Institute for Statistics.
Categorie:
Education
sono stati aggiornati
23 apr 2017 anni
Indicatori delle variazioni dei valori per anni
In media:
45.699
Minima:
41.967
1 gen 2013 anni
Massimo:
54.928
1 gen 2003 anni
Alla data di osservazione
Valore
Variazione assoluta
La variazione rispetto al valore precedente
1 gen 1999 anni
44.965
+44.965
0.0%
1 gen 2000 anni
47.764
+2.798
6.22%
1 gen 2003 anni
54.928
+7.164
15.0%
1 gen 2004 anni
45.843
-9.085
-16.54%
1 gen 2005 anni
44.592
-1.251
-2.73%
1 gen 2006 anni
45.705
+1.114
2.5%
1 gen 2007 anni
44.499
-1.206
-2.64%
1 gen 2008 anni
45.459
+0.959
2.16%
1 gen 2009 anni
44.712
-0.746
-1.64%
1 gen 2010 anni
43.268
-1.444
-3.23%
1 gen 2013 anni
41.967
-1.301
-3.01%
1 gen 2014 anni
44.688
+2.721
6.48%
Classificazione dei paesi secondo i statistiche attuali per anni