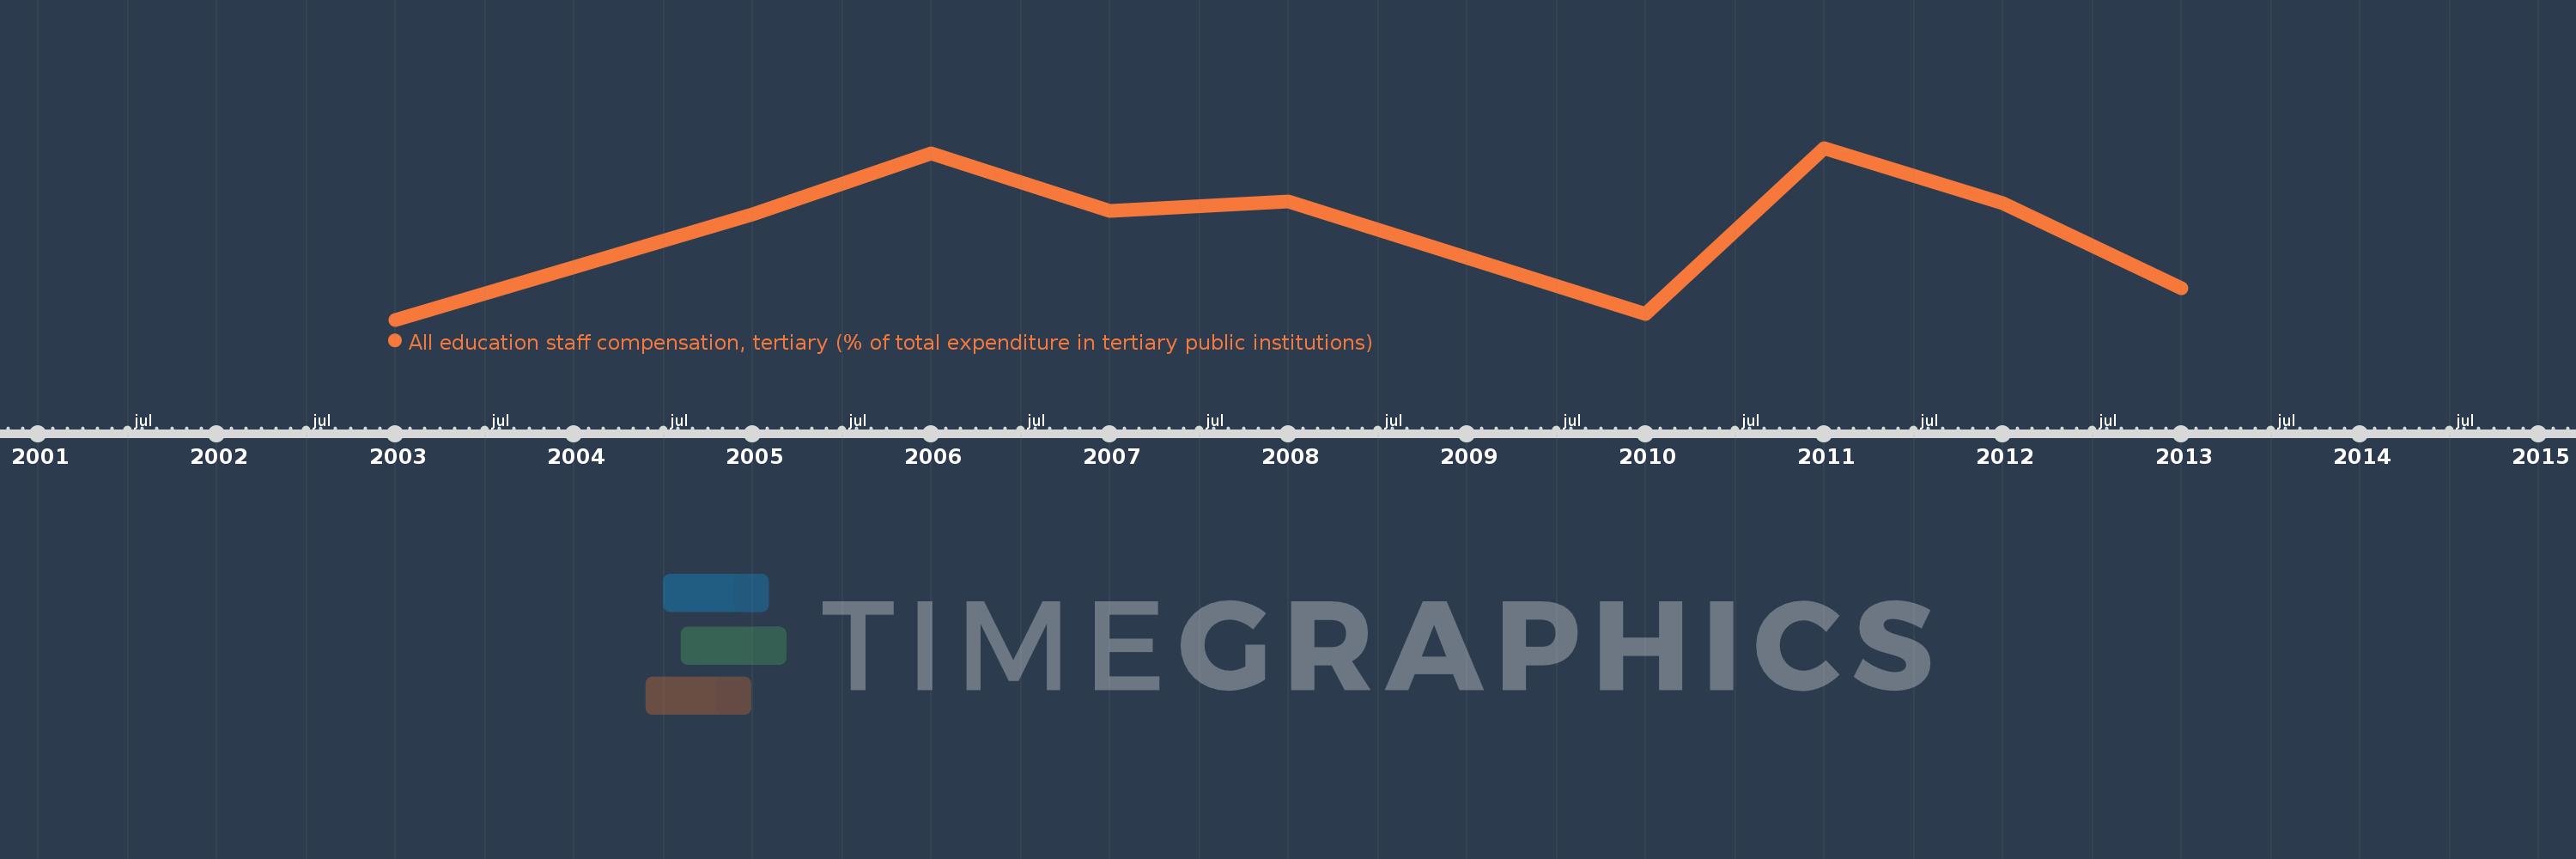
Questa scala temporale mostra un grafico dal 2003 anno al 2013 anno. Guyana. I dati fino ad 2002 anno non disponibili. Il numero di osservazioni attuali secondo i date: 9.
La fonte (nome):
Indicatori dello sviluppo mondiale
La fonte (organizzazione):
United Nations Educational, Scientific, and Cultural Organization (UNESCO) Institute for Statistics.
Categorie:
Education
sono stati aggiornati
23 apr 2017 anni
Indicatori delle variazioni dei valori per anni
In media:
61.752
Minima:
50.282
1 gen 2003 anni
Massimo:
71.774
1 gen 2011 anni
Alla data di osservazione
Valore
Variazione assoluta
La variazione rispetto al valore precedente
1 gen 2003 anni
50.282
+50.282
0.0%
1 gen 2005 anni
63.442
+13.16
26.17%
1 gen 2006 anni
71.14
+7.698
12.13%
1 gen 2007 anni
63.885
-7.255
-10.2%
1 gen 2008 anni
65.058
+1.173
1.84%
1 gen 2010 anni
51.055
-14.003
-21.52%
1 gen 2011 anni
71.774
+20.719
40.58%
1 gen 2012 anni
64.897
-6.876
-9.58%
1 gen 2013 anni
54.236
-10.661
-16.43%
Classificazione dei paesi secondo i statistiche attuali per anni