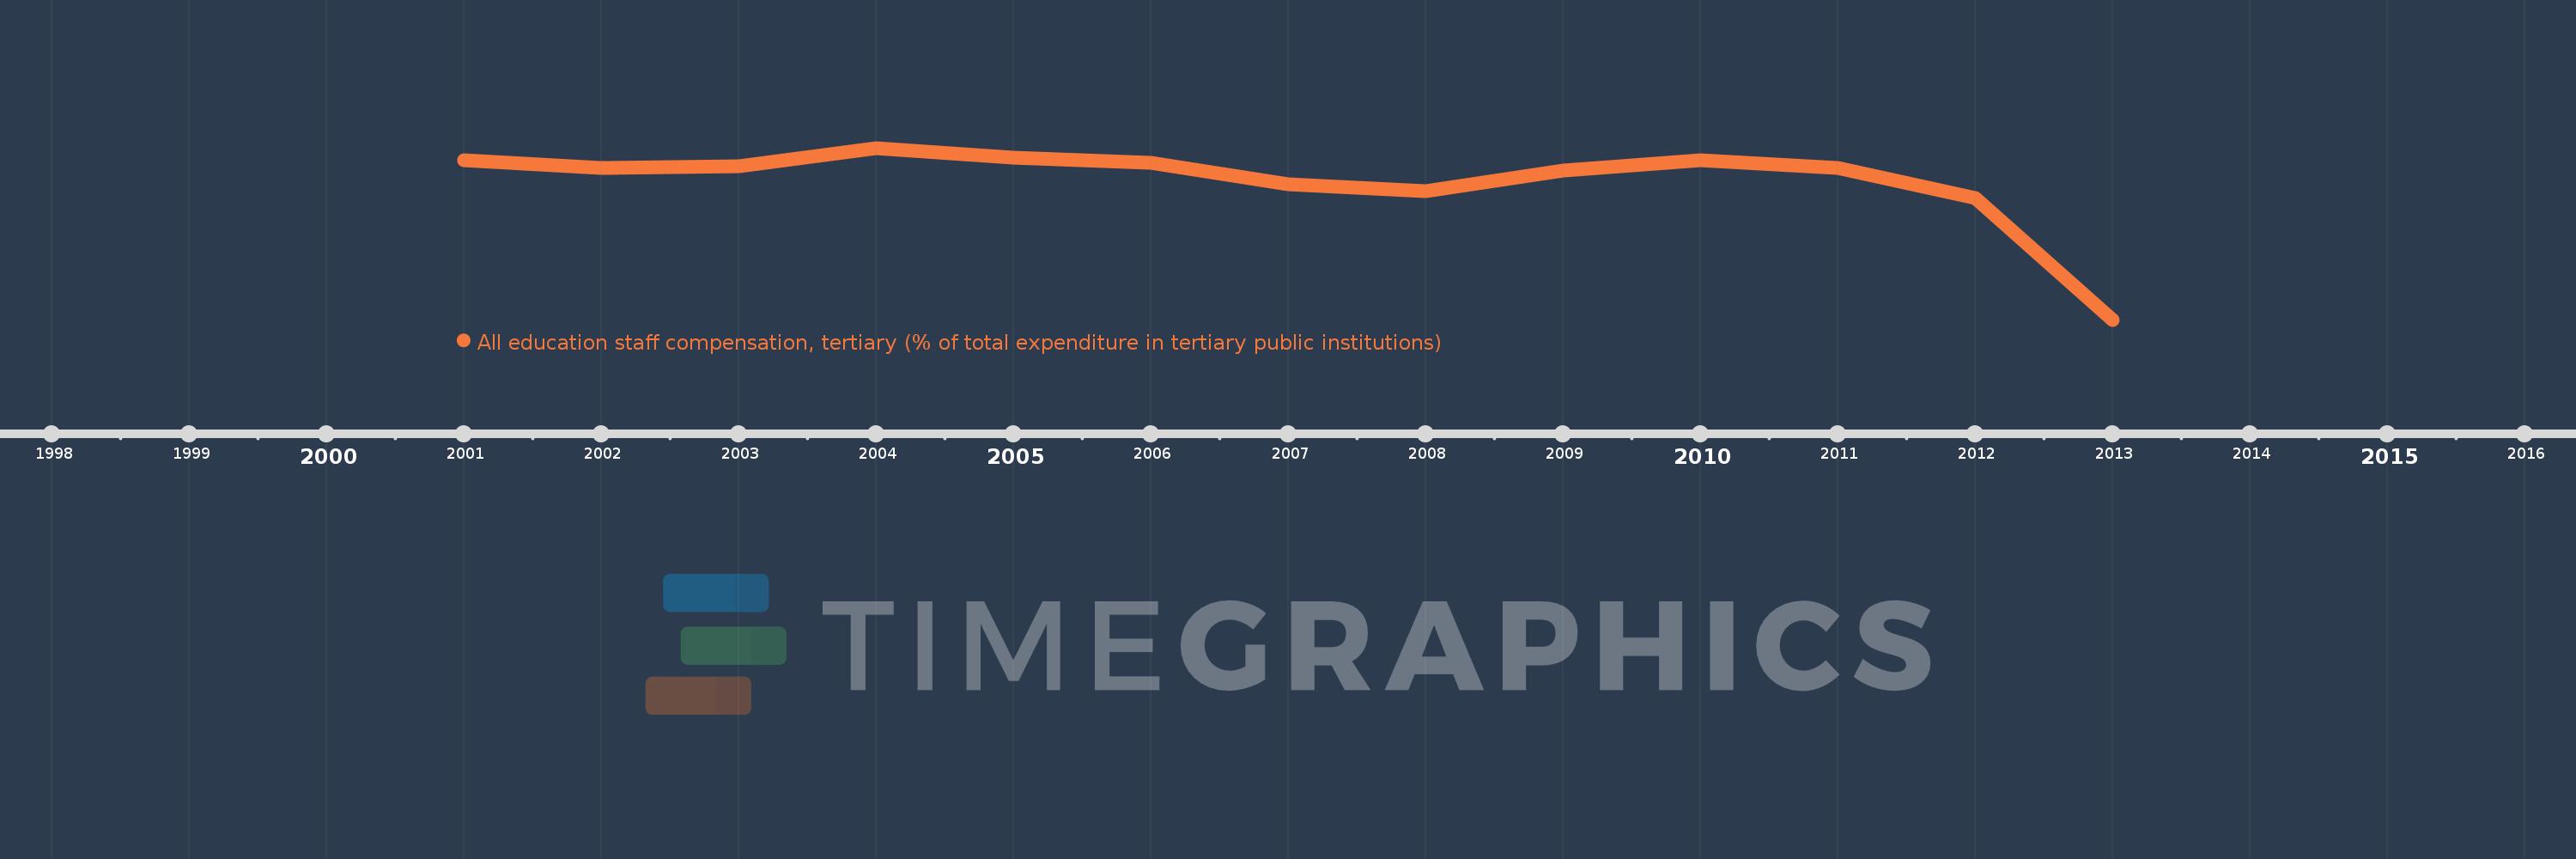
Questa scala temporale mostra un grafico dal 2001 anno al 2013 anno. Azerbaijan. I dati fino ad 2000 anno non disponibili. Il numero di osservazioni attuali secondo i date: 13.
La fonte (nome):
Indicatori dello sviluppo mondiale
La fonte (organizzazione):
United Nations Educational, Scientific, and Cultural Organization (UNESCO) Institute for Statistics.
Categorie:
Education
sono stati aggiornati
23 apr 2017 anni
Indicatori delle variazioni dei valori per anni
In media:
53.498
Minima:
12.947
1 gen 2013 anni
Massimo:
63.219
1 gen 2004 anni
Alla data di osservazione
Valore
Variazione assoluta
La variazione rispetto al valore precedente
1 gen 2001 anni
59.602
+59.602
0.0%
1 gen 2002 anni
57.264
-2.338
-3.92%
1 gen 2003 anni
57.744
+0.48
0.84%
1 gen 2004 anni
63.219
+5.474
9.48%
1 gen 2005 anni
60.45
-2.769
-4.38%
1 gen 2006 anni
58.881
-1.568
-2.59%
1 gen 2007 anni
52.57
-6.311
-10.72%
1 gen 2008 anni
50.469
-2.102
-4.0%
1 gen 2009 anni
56.672
+6.203
12.29%
1 gen 2010 anni
59.535
+2.863
5.05%
1 gen 2011 anni
57.442
-2.094
-3.52%
1 gen 2012 anni
48.678
-8.764
-15.26%
1 gen 2013 anni
12.947
-35.732
-73.4%
Classificazione dei paesi secondo i statistiche attuali per anni