Download Queste statistiche in altri paesi:
Linea del tempo:
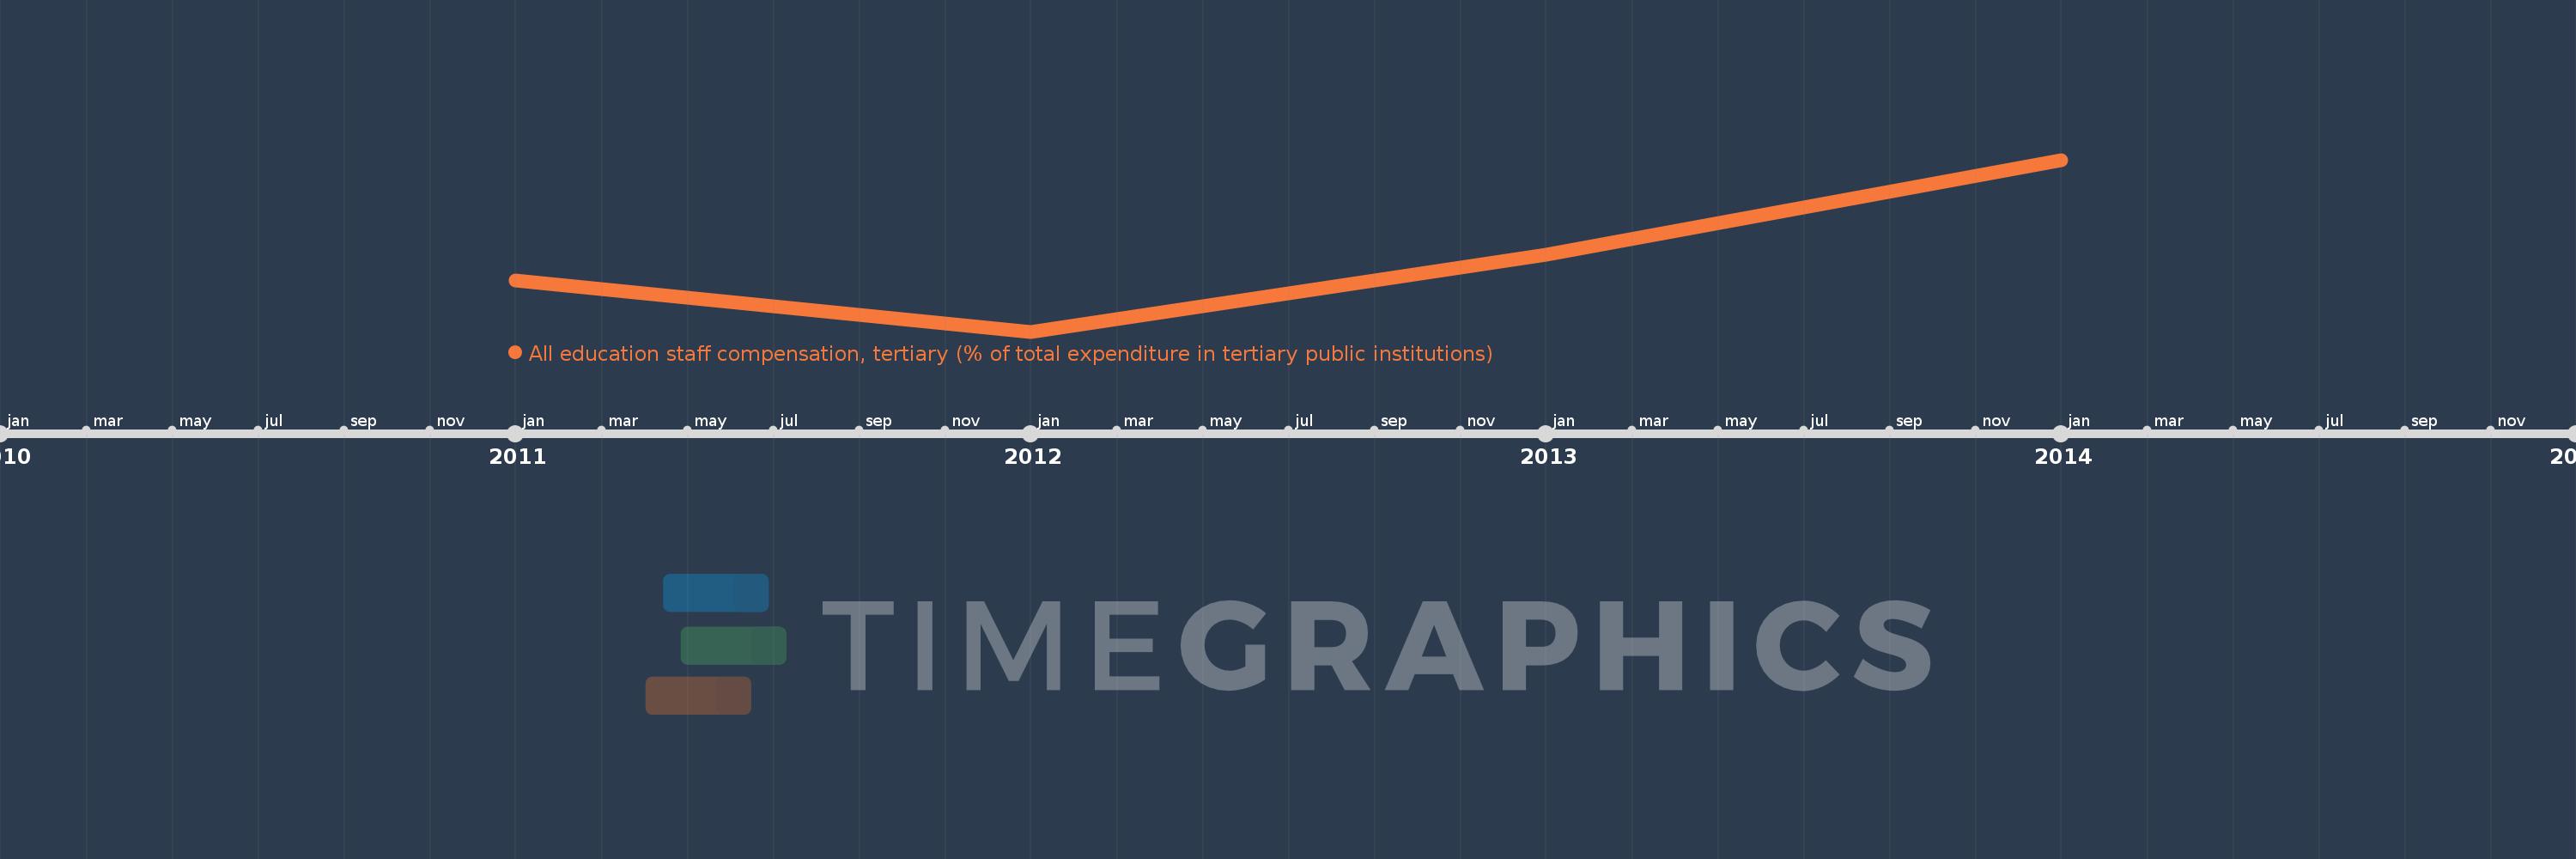
Questa scala temporale mostra un grafico dal 2011 anno al 2014 anno. Ecuador. I dati fino ad 2010 anno non disponibili. Il numero di osservazioni attuali secondo i date: 4.
La fonte (nome):
Indicatori dello sviluppo mondiale
La fonte (organizzazione):
United Nations Educational, Scientific, and Cultural Organization (UNESCO) Institute for Statistics.
Categorie:
Education
sono stati aggiornati
23 apr 2017 anni
Indicatori delle variazioni dei valori per anni
Minima:
36.212
1 gen 2012 anni
Massimo:
100.0
1 gen 2014 anni
Alla data di osservazione
Valore
Variazione assoluta
La variazione rispetto al valore precedente
1 gen 2011 anni
55.173
+55.173
0.0%
1 gen 2012 anni
36.212
-18.96
-34.37%
1 gen 2013 anni
64.696
+28.484
78.66%
1 gen 2014 anni
100.0
+35.304
54.57%
Classificazione dei paesi secondo i statistiche attuali per anni