29
/
en
AIzaSyAYiBZKx7MnpbEhh9jyipgxe19OcubqV5w
April 1, 2024
93344
Bulgaria
BGR
true
2
1
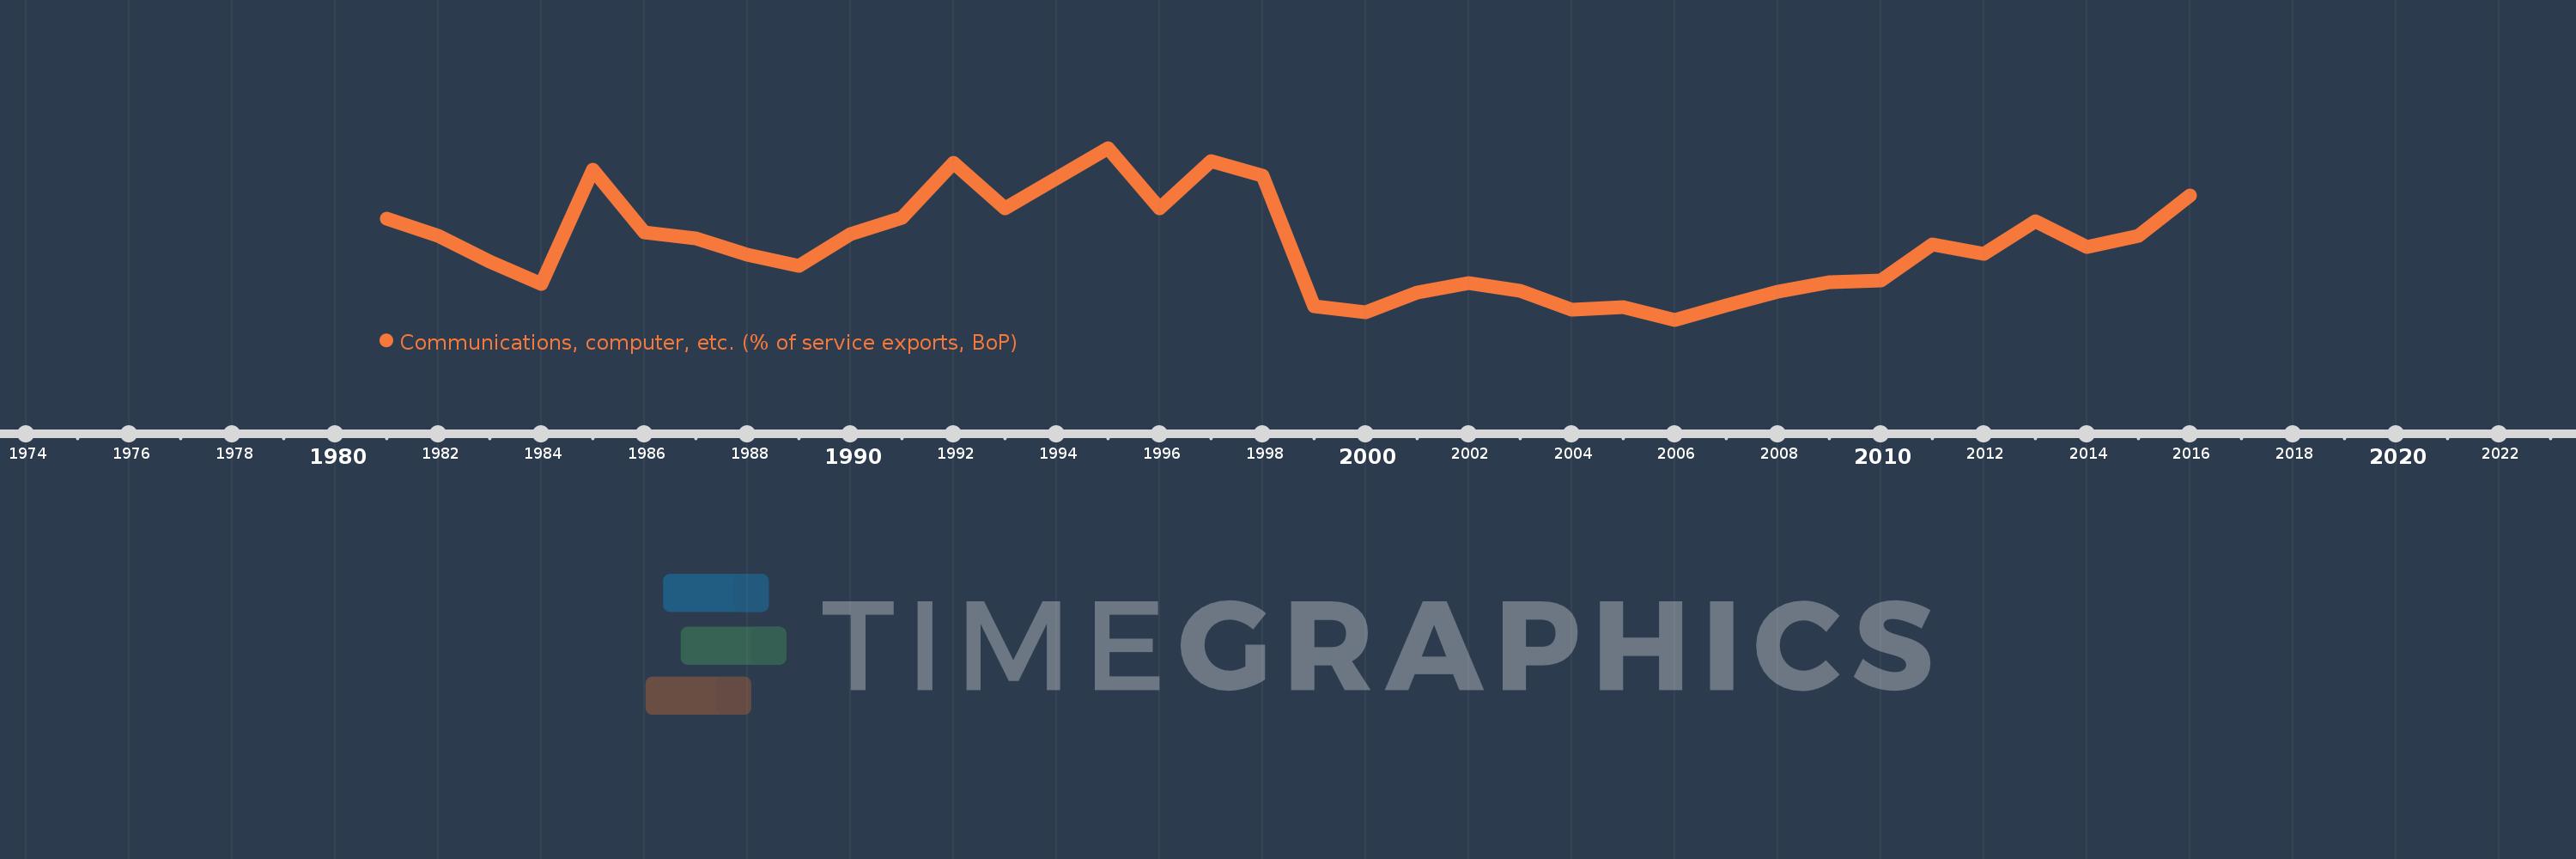
Communications, computer, etc. (% of service exports, BoP)
2016,2015,2014,2013,2012,2011,2010,2009,2008,2007,2006,2005,2004,2003,2002,2001,2000,1999,1998,1997,1996,1995,1994,1993,1992,1991,1990,1989,1988,1987,1986,1985,1984,1983,1982,1981
This statistics in other country:
AfghanistanAlbaniaAlgeriaAngolaAntigua and BarbudaArab WorldArgentinaArmeniaArubaAustraliaAustriaAzerbaijanBahamas, TheBahrainBangladeshBarbadosBelarusBelgiumBelizeBeninBermudaBhutanBoliviaBosnia and HerzegovinaBotswanaBrazilBrunei DarussalamBulgariaBurkina FasoBurundiCabo VerdeCambodiaCameroonCanadaCaribbean small statesCentral African RepublicCentral Europe and the BalticsChadChileChinaColombiaComorosCongo, Dem. Rep.Congo, Rep.Costa RicaCote d'IvoireCroatiaCuracaoCyprusCzech RepublicDenmarkDjiboutiDominicaDominican RepublicEarly-demographic dividendEast Asia & PacificEast Asia & Pacific (excluding high income)East Asia & Pacific (IDA & IBRD countries)EcuadorEgypt, Arab Rep.El SalvadorEquatorial GuineaEritreaEstoniaEthiopiaEuro areaEurope & Central AsiaEurope & Central Asia (excluding high income)Europe & Central Asia (IDA & IBRD countries)European UnionFaroe IslandsFijiFinlandFragile and conflict affected situationsFranceFrench PolynesiaGabonGambia, TheGeorgiaGermanyGhanaGreeceGrenadaGuatemalaGuineaGuinea-BissauGuyanaHaitiHeavily indebted poor countries (HIPC)High incomeHondurasHong Kong SAR, ChinaHungaryIBRD onlyIcelandIDA & IBRD totalIDA onlyIDA totalIndiaIndonesiaIran, Islamic Rep.IraqIrelandIsraelItalyJamaicaJapanJordanKazakhstanKenyaKiribatiKorea, Rep.KosovoKuwaitKyrgyz RepublicLao PDRLate-demographic dividendLatin America & Caribbean Latin America & Caribbean (excluding high income)Latin America & the Caribbean (IDA & IBRD countries)LatviaLeast developed countries: UN classificationLebanonLesothoLiberiaLibyaLithuaniaLow & middle incomeLow incomeLower middle incomeLuxembourgMacao SAR, ChinaMacedonia, FYRMadagascarMalawiMalaysiaMaldivesMaliMaltaMarshall IslandsMauritaniaMauritiusMexicoMicronesia, Fed. Sts.Middle East & North AfricaMiddle East & North Africa (excluding high income)Middle East & North Africa (IDA & IBRD countries)Middle incomeMoldovaMongoliaMontenegroMoroccoMozambiqueMyanmarNamibiaNepalNetherlandsNew CaledoniaNew ZealandNicaraguaNigerNigeriaNorth AmericaNorwayOECD membersOmanOther small statesPacific island small statesPakistanPalauPanamaPapua New GuineaParaguayPeruPhilippinesPolandPortugalPost-demographic dividendPre-demographic dividendQatarRomaniaRussian FederationRwandaSamoaSao Tome and PrincipeSaudi ArabiaSenegalSerbiaSeychellesSierra LeoneSingaporeSint Maarten (Dutch part)Slovak RepublicSloveniaSmall statesSolomon IslandsSouth AfricaSouth AsiaSouth Asia (IDA & IBRD)South SudanSpainSri LankaSt. Kitts and NevisSt. LuciaSt. Vincent and the GrenadinesSub-Saharan Africa Sub-Saharan Africa (excluding high income)Sub-Saharan Africa (IDA & IBRD countries)SudanSurinameSwazilandSwedenSwitzerlandSyrian Arab RepublicTajikistanTanzaniaThailandTimor-LesteTogoTongaTrinidad and TobagoTunisiaTurkeyTuvaluUgandaUkraineUnited KingdomUnited StatesUpper middle incomeUruguayVanuatuVenezuela, RBWest Bank and GazaWorldYemen, Rep.ZambiaZimbabwe Timeline:
This timeline shows a graph from 1981 to 2016 of Bulgaria. No data until 1980. Number of actual observations by date: 36.
Source name:
World Development Indicators
Source organization:
International Monetary Fund, Balance of Payments Statistics Yearbook and data files.
Categories, topics:
Economy & Growth, Trade
Last updated:
apr 23, 2017
Indicators value changes by year
Minimum:
16.204
jan 1, 2006
At the date of observation
Value
Absolute change
Change from previous value
jan 1, 1981
30.966
+30.966
0.0%
jan 1, 1982
28.505
-2.461
-7.95%
jan 1, 1983
24.689
-3.815
-13.39%
jan 1, 1984
21.435
-3.254
-13.18%
jan 1, 1985
38.178
+16.742
78.11%
jan 1, 1986
29.035
-9.142
-23.95%
jan 1, 1987
28.079
-0.956
-3.29%
jan 1, 1988
25.734
-2.345
-8.35%
jan 1, 1989
24.03
-1.704
-6.62%
jan 1, 1990
28.782
+4.751
19.77%
jan 1, 1991
31.183
+2.401
8.34%
jan 1, 1992
39.21
+8.027
25.74%
jan 1, 1993
32.496
-6.714
-17.12%
jan 1, 1994
36.874
+4.378
13.47%
jan 1, 1995
41.34
+4.466
12.11%
jan 1, 1996
32.472
-8.868
-21.45%
jan 1, 1997
39.414
+6.943
21.38%
jan 1, 1998
37.247
-2.168
-5.5%
jan 1, 1999
18.239
-19.008
-51.03%
jan 1, 2000
17.271
-0.969
-5.31%
jan 1, 2001
20.176
+2.906
16.82%
jan 1, 2002
21.543
+1.367
6.77%
jan 1, 2003
20.45
-1.093
-5.07%
jan 1, 2004
17.616
-2.834
-13.86%
jan 1, 2005
18.103
+0.486
2.76%
jan 1, 2006
16.204
-1.899
-10.49%
jan 1, 2007
18.278
+2.074
12.8%
jan 1, 2008
20.255
+1.977
10.82%
jan 1, 2009
21.744
+1.489
7.35%
jan 1, 2010
21.895
+0.151
0.69%
jan 1, 2011
27.241
+5.347
24.42%
jan 1, 2012
25.886
-1.355
-4.98%
jan 1, 2013
30.676
+4.79
18.5%
jan 1, 2014
26.82
-3.856
-12.57%
jan 1, 2015
28.436
+1.616
6.02%
jan 1, 2016
34.338
+5.902
20.75%
Ranking of countries by current statistics by years


Comments: