29
/
en
AIzaSyAYiBZKx7MnpbEhh9jyipgxe19OcubqV5w
April 1, 2024
34826
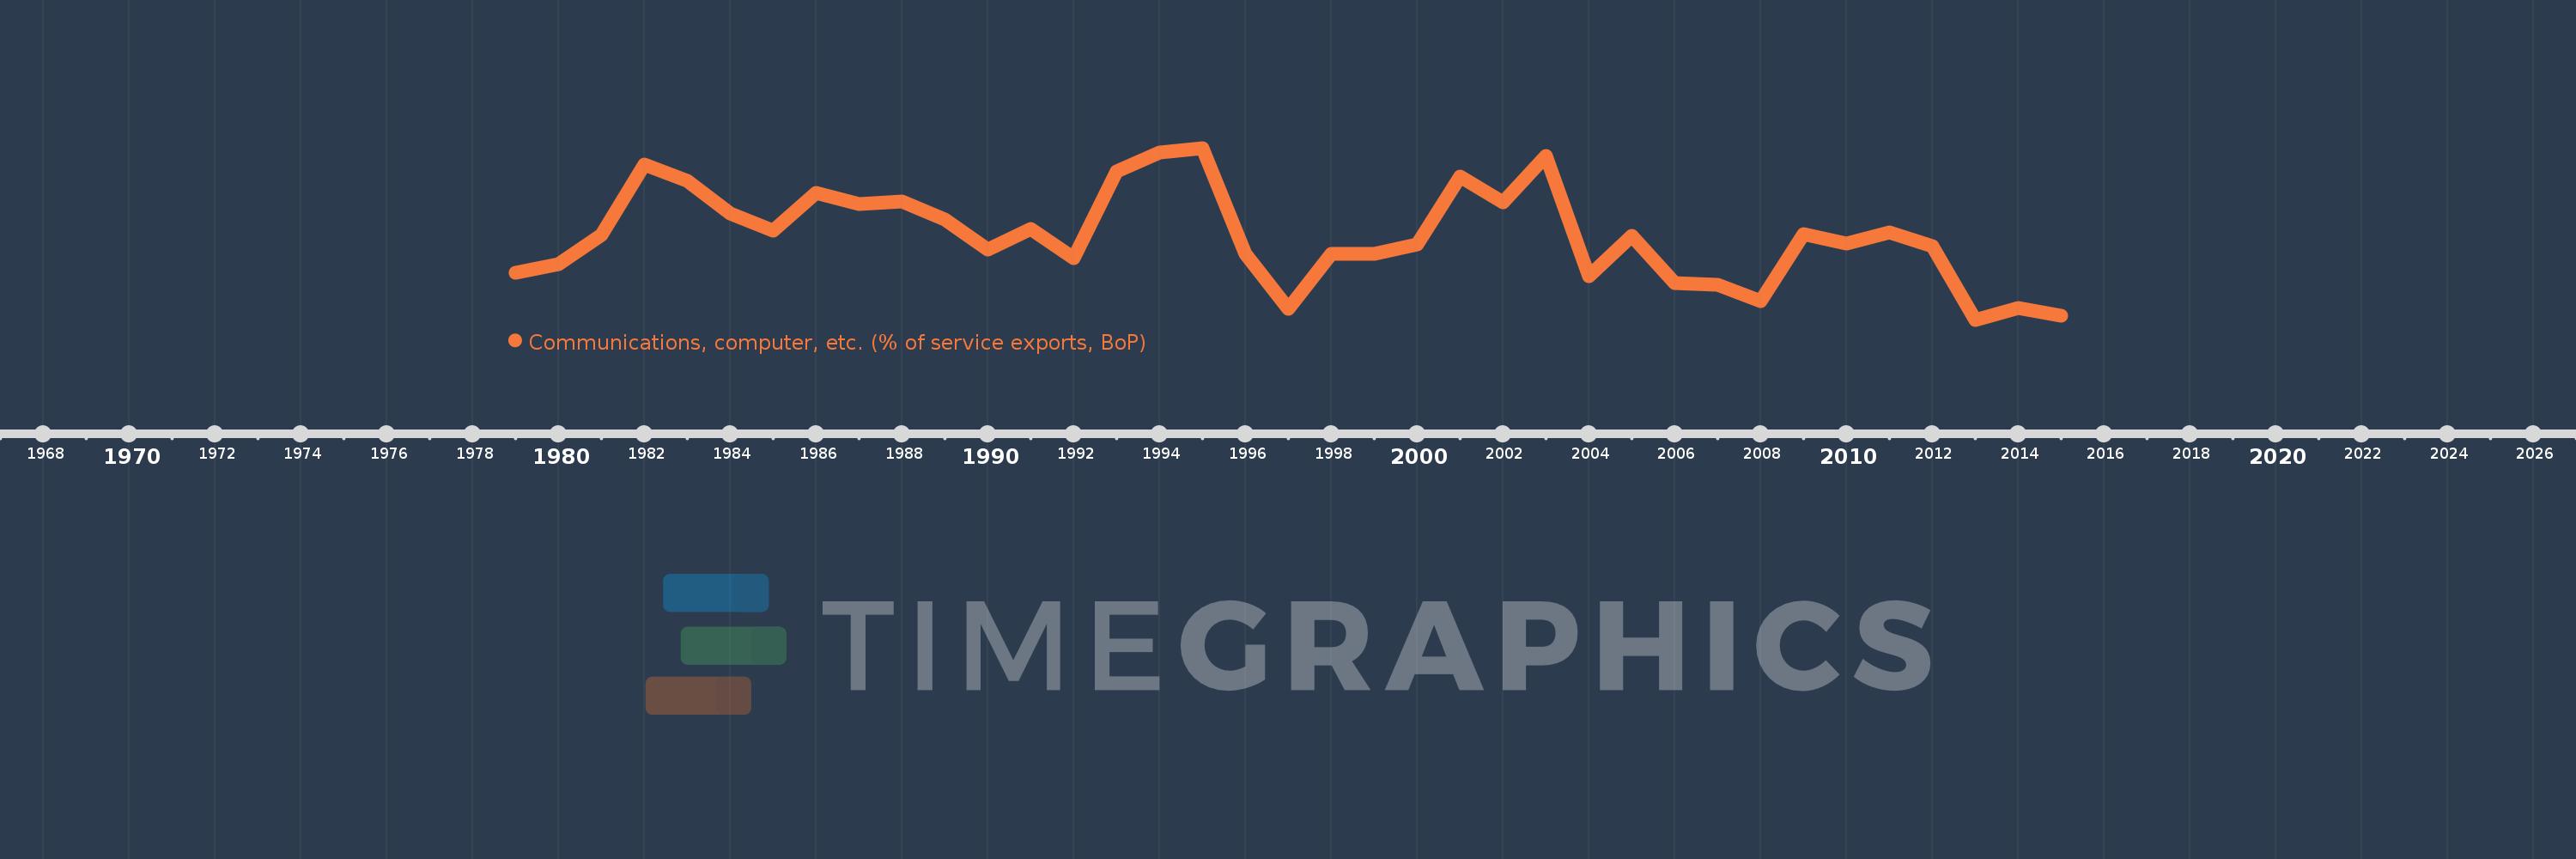
Heavily indebted poor countries (HIPC)
HPC
false
2
1
Communications, computer, etc. (% of service exports, BoP)
2015,2014,2013,2012,2011,2010,2009,2008,2007,2006,2005,2004,2003,2002,2001,2000,1999,1998,1997,1996,1995,1994,1993,1992,1991,1990,1989,1988,1987,1986,1985,1984,1983,1982,1981,1980,1979
This statistics in other country:
AfghanistanAlbaniaAlgeriaAngolaAntigua and BarbudaArab WorldArgentinaArmeniaArubaAustraliaAustriaAzerbaijanBahamas, TheBahrainBangladeshBarbadosBelarusBelgiumBelizeBeninBermudaBhutanBoliviaBosnia and HerzegovinaBotswanaBrazilBrunei DarussalamBulgariaBurkina FasoBurundiCabo VerdeCambodiaCameroonCanadaCaribbean small statesCentral African RepublicCentral Europe and the BalticsChadChileChinaColombiaComorosCongo, Dem. Rep.Congo, Rep.Costa RicaCote d'IvoireCroatiaCuracaoCyprusCzech RepublicDenmarkDjiboutiDominicaDominican RepublicEarly-demographic dividendEast Asia & PacificEast Asia & Pacific (excluding high income)East Asia & Pacific (IDA & IBRD countries)EcuadorEgypt, Arab Rep.El SalvadorEquatorial GuineaEritreaEstoniaEthiopiaEuro areaEurope & Central AsiaEurope & Central Asia (excluding high income)Europe & Central Asia (IDA & IBRD countries)European UnionFaroe IslandsFijiFinlandFragile and conflict affected situationsFranceFrench PolynesiaGabonGambia, TheGeorgiaGermanyGhanaGreeceGrenadaGuatemalaGuineaGuinea-BissauGuyanaHaitiHeavily indebted poor countries (HIPC)High incomeHondurasHong Kong SAR, ChinaHungaryIBRD onlyIcelandIDA & IBRD totalIDA onlyIDA totalIndiaIndonesiaIran, Islamic Rep.IraqIrelandIsraelItalyJamaicaJapanJordanKazakhstanKenyaKiribatiKorea, Rep.KosovoKuwaitKyrgyz RepublicLao PDRLate-demographic dividendLatin America & Caribbean Latin America & Caribbean (excluding high income)Latin America & the Caribbean (IDA & IBRD countries)LatviaLeast developed countries: UN classificationLebanonLesothoLiberiaLibyaLithuaniaLow & middle incomeLow incomeLower middle incomeLuxembourgMacao SAR, ChinaMacedonia, FYRMadagascarMalawiMalaysiaMaldivesMaliMaltaMarshall IslandsMauritaniaMauritiusMexicoMicronesia, Fed. Sts.Middle East & North AfricaMiddle East & North Africa (excluding high income)Middle East & North Africa (IDA & IBRD countries)Middle incomeMoldovaMongoliaMontenegroMoroccoMozambiqueMyanmarNamibiaNepalNetherlandsNew CaledoniaNew ZealandNicaraguaNigerNigeriaNorth AmericaNorwayOECD membersOmanOther small statesPacific island small statesPakistanPalauPanamaPapua New GuineaParaguayPeruPhilippinesPolandPortugalPost-demographic dividendPre-demographic dividendQatarRomaniaRussian FederationRwandaSamoaSao Tome and PrincipeSaudi ArabiaSenegalSerbiaSeychellesSierra LeoneSingaporeSint Maarten (Dutch part)Slovak RepublicSloveniaSmall statesSolomon IslandsSouth AfricaSouth AsiaSouth Asia (IDA & IBRD)South SudanSpainSri LankaSt. Kitts and NevisSt. LuciaSt. Vincent and the GrenadinesSub-Saharan Africa Sub-Saharan Africa (excluding high income)Sub-Saharan Africa (IDA & IBRD countries)SudanSurinameSwazilandSwedenSwitzerlandSyrian Arab RepublicTajikistanTanzaniaThailandTimor-LesteTogoTongaTrinidad and TobagoTunisiaTurkeyTuvaluUgandaUkraineUnited KingdomUnited StatesUpper middle incomeUruguayVanuatuVenezuela, RBWest Bank and GazaWorldYemen, Rep.ZambiaZimbabwe Timeline:
This timeline shows a graph from 1979 to 2015 of Heavily indebted poor countries (HIPC). No data until 1978. Number of actual observations by date: 37.
Source name:
World Development Indicators
Source organization:
International Monetary Fund, Balance of Payments Statistics Yearbook and data files.
Categories, topics:
Economy & Growth, Trade
Last updated:
apr 23, 2017
Indicators value changes by year
Minimum:
37.181
jan 1, 2013
Maximum:
49.334
jan 1, 1995
At the date of observation
Value
Absolute change
Change from previous value
jan 1, 1979
40.481
+40.481
0.0%
jan 1, 1980
41.095
+0.614
1.52%
jan 1, 1981
43.193
+2.097
5.1%
jan 1, 1982
48.188
+4.995
11.56%
jan 1, 1983
47.014
-1.173
-2.43%
jan 1, 1984
44.72
-2.294
-4.88%
jan 1, 1985
43.477
-1.243
-2.78%
jan 1, 1986
46.158
+2.681
6.17%
jan 1, 1987
45.395
-0.763
-1.65%
jan 1, 1988
45.558
+0.163
0.36%
jan 1, 1989
44.283
-1.275
-2.8%
jan 1, 1990
42.161
-2.122
-4.79%
jan 1, 1991
43.583
+1.422
3.37%
jan 1, 1992
41.558
-2.025
-4.65%
jan 1, 1993
47.703
+6.144
14.78%
jan 1, 1994
48.982
+1.279
2.68%
jan 1, 1995
49.334
+0.352
0.72%
jan 1, 1996
41.826
-7.508
-15.22%
jan 1, 1997
37.981
-3.846
-9.19%
jan 1, 1998
41.825
+3.844
10.12%
jan 1, 1999
41.86
+0.036
0.09%
jan 1, 2000
42.526
+0.665
1.59%
jan 1, 2001
47.307
+4.782
11.24%
jan 1, 2002
45.509
-1.798
-3.8%
jan 1, 2003
48.774
+3.264
7.17%
jan 1, 2004
40.279
-8.495
-17.42%
jan 1, 2005
43.143
+2.864
7.11%
jan 1, 2006
39.781
-3.361
-7.79%
jan 1, 2007
39.644
-0.137
-0.35%
jan 1, 2008
38.483
-1.161
-2.93%
jan 1, 2009
43.251
+4.768
12.39%
jan 1, 2010
42.577
-0.673
-1.56%
jan 1, 2011
43.39
+0.813
1.91%
jan 1, 2012
42.363
-1.028
-2.37%
jan 1, 2013
37.181
-5.182
-12.23%
jan 1, 2014
38.037
+0.857
2.3%
jan 1, 2015
37.477
-0.56
-1.47%
Ranking of countries by current statistics by years


Comments: