29
/
en
AIzaSyAYiBZKx7MnpbEhh9jyipgxe19OcubqV5w
April 1, 2024
133926
France
FRA
true
2
1
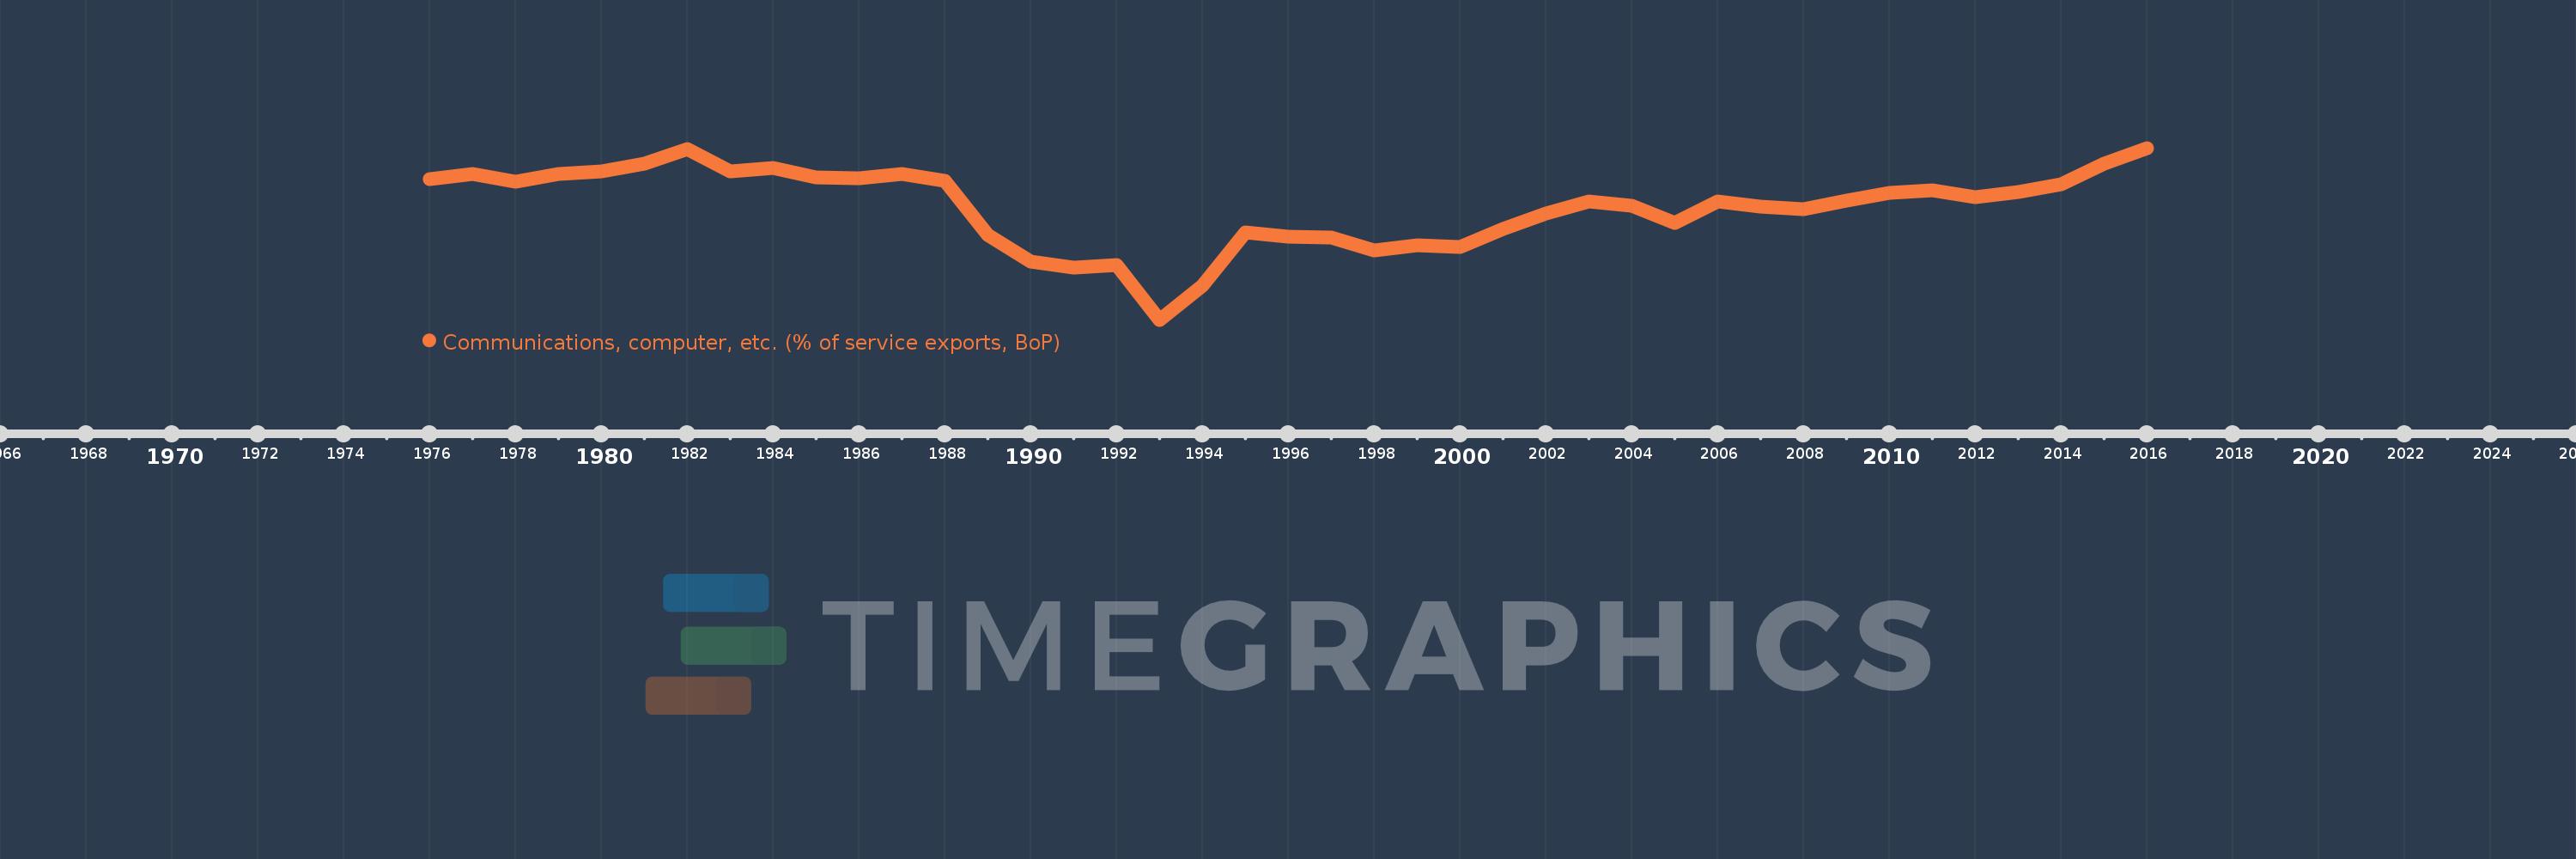
Communications, computer, etc. (% of service exports, BoP)
2016,2015,2014,2013,2012,2011,2010,2009,2008,2007,2006,2005,2004,2003,2002,2001,2000,1999,1998,1997,1996,1995,1994,1993,1992,1991,1990,1989,1988,1987,1986,1985,1984,1983,1982,1981,1980,1979,1978,1977,1976
This statistics in other country:
AfghanistanAlbaniaAlgeriaAngolaAntigua and BarbudaArab WorldArgentinaArmeniaArubaAustraliaAustriaAzerbaijanBahamas, TheBahrainBangladeshBarbadosBelarusBelgiumBelizeBeninBermudaBhutanBoliviaBosnia and HerzegovinaBotswanaBrazilBrunei DarussalamBulgariaBurkina FasoBurundiCabo VerdeCambodiaCameroonCanadaCaribbean small statesCentral African RepublicCentral Europe and the BalticsChadChileChinaColombiaComorosCongo, Dem. Rep.Congo, Rep.Costa RicaCote d'IvoireCroatiaCuracaoCyprusCzech RepublicDenmarkDjiboutiDominicaDominican RepublicEarly-demographic dividendEast Asia & PacificEast Asia & Pacific (excluding high income)East Asia & Pacific (IDA & IBRD countries)EcuadorEgypt, Arab Rep.El SalvadorEquatorial GuineaEritreaEstoniaEthiopiaEuro areaEurope & Central AsiaEurope & Central Asia (excluding high income)Europe & Central Asia (IDA & IBRD countries)European UnionFaroe IslandsFijiFinlandFragile and conflict affected situationsFranceFrench PolynesiaGabonGambia, TheGeorgiaGermanyGhanaGreeceGrenadaGuatemalaGuineaGuinea-BissauGuyanaHaitiHeavily indebted poor countries (HIPC)High incomeHondurasHong Kong SAR, ChinaHungaryIBRD onlyIcelandIDA & IBRD totalIDA onlyIDA totalIndiaIndonesiaIran, Islamic Rep.IraqIrelandIsraelItalyJamaicaJapanJordanKazakhstanKenyaKiribatiKorea, Rep.KosovoKuwaitKyrgyz RepublicLao PDRLate-demographic dividendLatin America & Caribbean Latin America & Caribbean (excluding high income)Latin America & the Caribbean (IDA & IBRD countries)LatviaLeast developed countries: UN classificationLebanonLesothoLiberiaLibyaLithuaniaLow & middle incomeLow incomeLower middle incomeLuxembourgMacao SAR, ChinaMacedonia, FYRMadagascarMalawiMalaysiaMaldivesMaliMaltaMarshall IslandsMauritaniaMauritiusMexicoMicronesia, Fed. Sts.Middle East & North AfricaMiddle East & North Africa (excluding high income)Middle East & North Africa (IDA & IBRD countries)Middle incomeMoldovaMongoliaMontenegroMoroccoMozambiqueMyanmarNamibiaNepalNetherlandsNew CaledoniaNew ZealandNicaraguaNigerNigeriaNorth AmericaNorwayOECD membersOmanOther small statesPacific island small statesPakistanPalauPanamaPapua New GuineaParaguayPeruPhilippinesPolandPortugalPost-demographic dividendPre-demographic dividendQatarRomaniaRussian FederationRwandaSamoaSao Tome and PrincipeSaudi ArabiaSenegalSerbiaSeychellesSierra LeoneSingaporeSint Maarten (Dutch part)Slovak RepublicSloveniaSmall statesSolomon IslandsSouth AfricaSouth AsiaSouth Asia (IDA & IBRD)South SudanSpainSri LankaSt. Kitts and NevisSt. LuciaSt. Vincent and the GrenadinesSub-Saharan Africa Sub-Saharan Africa (excluding high income)Sub-Saharan Africa (IDA & IBRD countries)SudanSurinameSwazilandSwedenSwitzerlandSyrian Arab RepublicTajikistanTanzaniaThailandTimor-LesteTogoTongaTrinidad and TobagoTunisiaTurkeyTuvaluUgandaUkraineUnited KingdomUnited StatesUpper middle incomeUruguayVanuatuVenezuela, RBWest Bank and GazaWorldYemen, Rep.ZambiaZimbabwe Timeline:
This timeline shows a graph from 1976 to 2016 of France. No data until 1975. Number of actual observations by date: 41.
Source name:
World Development Indicators
Source organization:
International Monetary Fund, Balance of Payments Statistics Yearbook and data files.
Categories, topics:
Economy & Growth, Trade
Last updated:
apr 23, 2017
Indicators value changes by year
Minimum:
31.079
jan 1, 1993
Maximum:
55.981
jan 1, 2016
At the date of observation
Value
Absolute change
Change from previous value
jan 1, 1976
51.499
+51.499
0.0%
jan 1, 1977
52.161
+0.661
1.28%
jan 1, 1978
51.126
-1.035
-1.98%
jan 1, 1979
52.2
+1.074
2.1%
jan 1, 1980
52.609
+0.409
0.78%
jan 1, 1981
53.681
+1.072
2.04%
jan 1, 1982
55.847
+2.166
4.03%
jan 1, 1983
52.593
-3.253
-5.83%
jan 1, 1984
53.026
+0.433
0.82%
jan 1, 1985
51.735
-1.291
-2.43%
jan 1, 1986
51.624
-0.111
-0.22%
jan 1, 1987
52.225
+0.601
1.16%
jan 1, 1988
51.267
-0.958
-1.83%
jan 1, 1989
43.419
-7.847
-15.31%
jan 1, 1990
39.457
-3.963
-9.13%
jan 1, 1991
38.649
-0.808
-2.05%
jan 1, 1992
38.979
+0.33
0.85%
jan 1, 1993
31.079
-7.9
-20.27%
jan 1, 1994
35.987
+4.908
15.79%
jan 1, 1995
43.73
+7.743
21.52%
jan 1, 1996
43.074
-0.656
-1.5%
jan 1, 1997
43.015
-0.059
-0.14%
jan 1, 1998
41.13
-1.885
-4.38%
jan 1, 1999
41.852
+0.721
1.75%
jan 1, 2000
41.681
-0.171
-0.41%
jan 1, 2001
44.255
+2.574
6.18%
jan 1, 2002
46.421
+2.166
4.9%
jan 1, 2003
48.263
+1.842
3.97%
jan 1, 2004
47.592
-0.672
-1.39%
jan 1, 2005
45.05
-2.542
-5.34%
jan 1, 2006
48.226
+3.176
7.05%
jan 1, 2007
47.526
-0.7
-1.45%
jan 1, 2008
47.144
-0.382
-0.8%
jan 1, 2009
48.326
+1.182
2.51%
jan 1, 2010
49.513
+1.187
2.46%
jan 1, 2011
49.901
+0.388
0.78%
jan 1, 2012
48.86
-1.041
-2.09%
jan 1, 2013
49.613
+0.753
1.54%
jan 1, 2014
50.694
+1.081
2.18%
jan 1, 2015
53.669
+2.975
5.87%
jan 1, 2016
55.981
+2.312
4.31%
Ranking of countries by current statistics by years


Comments: