29
/
en
AIzaSyAYiBZKx7MnpbEhh9jyipgxe19OcubqV5w
April 1, 2024
121897
Dominican Republic
DOM
true
2
1
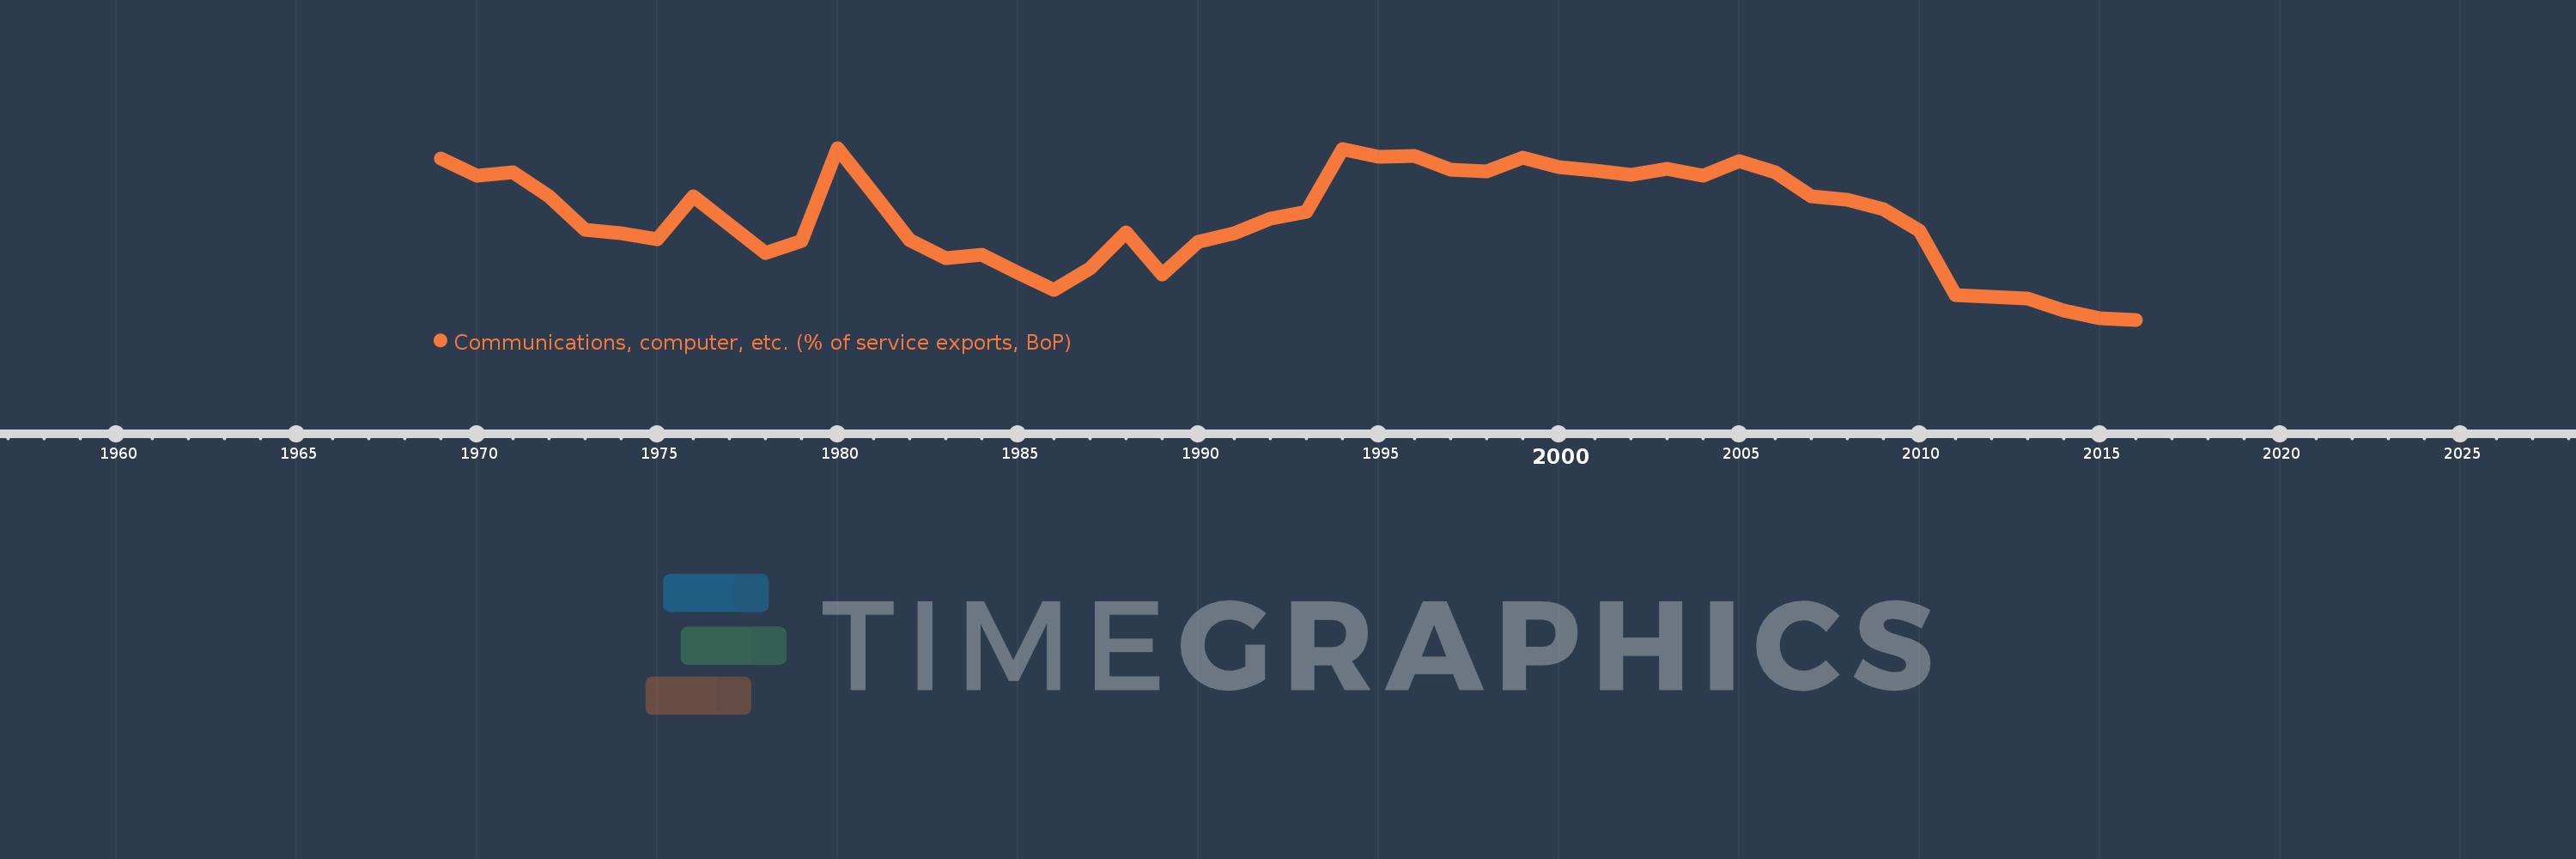
Communications, computer, etc. (% of service exports, BoP)
2016,2015,2014,2013,2012,2011,2010,2009,2008,2007,2006,2005,2004,2003,2002,2001,2000,1999,1998,1997,1996,1995,1994,1993,1992,1991,1990,1989,1988,1987,1986,1985,1984,1983,1982,1981,1980,1979,1978,1977,1976,1975,1974,1973,1972,1971,1970,1969
This statistics in other country:
AfghanistanAlbaniaAlgeriaAngolaAntigua and BarbudaArab WorldArgentinaArmeniaArubaAustraliaAustriaAzerbaijanBahamas, TheBahrainBangladeshBarbadosBelarusBelgiumBelizeBeninBermudaBhutanBoliviaBosnia and HerzegovinaBotswanaBrazilBrunei DarussalamBulgariaBurkina FasoBurundiCabo VerdeCambodiaCameroonCanadaCaribbean small statesCentral African RepublicCentral Europe and the BalticsChadChileChinaColombiaComorosCongo, Dem. Rep.Congo, Rep.Costa RicaCote d'IvoireCroatiaCuracaoCyprusCzech RepublicDenmarkDjiboutiDominicaDominican RepublicEarly-demographic dividendEast Asia & PacificEast Asia & Pacific (excluding high income)East Asia & Pacific (IDA & IBRD countries)EcuadorEgypt, Arab Rep.El SalvadorEquatorial GuineaEritreaEstoniaEthiopiaEuro areaEurope & Central AsiaEurope & Central Asia (excluding high income)Europe & Central Asia (IDA & IBRD countries)European UnionFaroe IslandsFijiFinlandFragile and conflict affected situationsFranceFrench PolynesiaGabonGambia, TheGeorgiaGermanyGhanaGreeceGrenadaGuatemalaGuineaGuinea-BissauGuyanaHaitiHeavily indebted poor countries (HIPC)High incomeHondurasHong Kong SAR, ChinaHungaryIBRD onlyIcelandIDA & IBRD totalIDA onlyIDA totalIndiaIndonesiaIran, Islamic Rep.IraqIrelandIsraelItalyJamaicaJapanJordanKazakhstanKenyaKiribatiKorea, Rep.KosovoKuwaitKyrgyz RepublicLao PDRLate-demographic dividendLatin America & Caribbean Latin America & Caribbean (excluding high income)Latin America & the Caribbean (IDA & IBRD countries)LatviaLeast developed countries: UN classificationLebanonLesothoLiberiaLibyaLithuaniaLow & middle incomeLow incomeLower middle incomeLuxembourgMacao SAR, ChinaMacedonia, FYRMadagascarMalawiMalaysiaMaldivesMaliMaltaMarshall IslandsMauritaniaMauritiusMexicoMicronesia, Fed. Sts.Middle East & North AfricaMiddle East & North Africa (excluding high income)Middle East & North Africa (IDA & IBRD countries)Middle incomeMoldovaMongoliaMontenegroMoroccoMozambiqueMyanmarNamibiaNepalNetherlandsNew CaledoniaNew ZealandNicaraguaNigerNigeriaNorth AmericaNorwayOECD membersOmanOther small statesPacific island small statesPakistanPalauPanamaPapua New GuineaParaguayPeruPhilippinesPolandPortugalPost-demographic dividendPre-demographic dividendQatarRomaniaRussian FederationRwandaSamoaSao Tome and PrincipeSaudi ArabiaSenegalSerbiaSeychellesSierra LeoneSingaporeSint Maarten (Dutch part)Slovak RepublicSloveniaSmall statesSolomon IslandsSouth AfricaSouth AsiaSouth Asia (IDA & IBRD)South SudanSpainSri LankaSt. Kitts and NevisSt. LuciaSt. Vincent and the GrenadinesSub-Saharan Africa Sub-Saharan Africa (excluding high income)Sub-Saharan Africa (IDA & IBRD countries)SudanSurinameSwazilandSwedenSwitzerlandSyrian Arab RepublicTajikistanTanzaniaThailandTimor-LesteTogoTongaTrinidad and TobagoTunisiaTurkeyTuvaluUgandaUkraineUnited KingdomUnited StatesUpper middle incomeUruguayVanuatuVenezuela, RBWest Bank and GazaWorldYemen, Rep.ZambiaZimbabwe Timeline:
This timeline shows a graph from 1969 to 2016 of Dominican Republic. No data until 1968. Number of actual observations by date: 48.
Source name:
World Development Indicators
Source organization:
International Monetary Fund, Balance of Payments Statistics Yearbook and data files.
Categories, topics:
Economy & Growth, Trade
Last updated:
apr 23, 2017
Indicators value changes by year
Minimum:
10.818
jan 1, 2016
Maximum:
45.137
jan 1, 1980
At the date of observation
Value
Absolute change
Change from previous value
jan 1, 1969
43.056
+43.056
0.0%
jan 1, 1970
39.679
-3.377
-7.84%
jan 1, 1971
40.233
+0.554
1.4%
jan 1, 1972
35.556
-4.677
-11.62%
jan 1, 1973
28.819
-6.737
-18.95%
jan 1, 1974
28.112
-0.707
-2.45%
jan 1, 1975
26.874
-1.238
-4.4%
jan 1, 1976
35.456
+8.582
31.94%
jan 1, 1977
29.812
-5.644
-15.92%
jan 1, 1978
24.131
-5.681
-19.06%
jan 1, 1979
26.623
+2.492
10.33%
jan 1, 1980
45.137
+18.514
69.54%
jan 1, 1981
35.908
-9.229
-20.45%
jan 1, 1982
26.771
-9.137
-25.44%
jan 1, 1983
23.202
-3.569
-13.33%
jan 1, 1984
23.784
+0.582
2.51%
jan 1, 1985
20.239
-3.545
-14.91%
jan 1, 1986
16.738
-3.501
-17.3%
jan 1, 1987
21.071
+4.333
25.89%
jan 1, 1988
28.345
+7.274
34.52%
jan 1, 1989
19.933
-8.412
-29.68%
jan 1, 1990
26.318
+6.385
32.03%
jan 1, 1991
28.071
+1.753
6.66%
jan 1, 1992
30.984
+2.912
10.37%
jan 1, 1993
32.367
+1.383
4.46%
jan 1, 1994
44.959
+12.592
38.9%
jan 1, 1995
43.421
-1.537
-3.42%
jan 1, 1996
43.474
+0.053
0.12%
jan 1, 1997
40.726
-2.749
-6.32%
jan 1, 1998
40.424
-0.301
-0.74%
jan 1, 1999
43.225
+2.801
6.93%
jan 1, 2000
41.332
-1.893
-4.38%
jan 1, 2001
40.56
-0.772
-1.87%
jan 1, 2002
39.838
-0.721
-1.78%
jan 1, 2003
41.022
+1.183
2.97%
jan 1, 2004
39.549
-1.472
-3.59%
jan 1, 2005
42.508
+2.959
7.48%
jan 1, 2006
40.285
-2.224
-5.23%
jan 1, 2007
35.479
-4.805
-11.93%
jan 1, 2008
34.714
-0.766
-2.16%
jan 1, 2009
32.821
-1.893
-5.45%
jan 1, 2010
28.601
-4.22
-12.86%
jan 1, 2011
15.704
-12.897
-45.09%
jan 1, 2012
15.46
-0.244
-1.55%
jan 1, 2013
15.013
-0.447
-2.89%
jan 1, 2014
12.648
-2.365
-15.75%
jan 1, 2015
11.162
-1.486
-11.75%
jan 1, 2016
10.818
-0.344
-3.08%
Ranking of countries by current statistics by years


Comments: