29
/
en
AIzaSyAYiBZKx7MnpbEhh9jyipgxe19OcubqV5w
April 1, 2024
171524
Kuwait
KWT
true
2
1
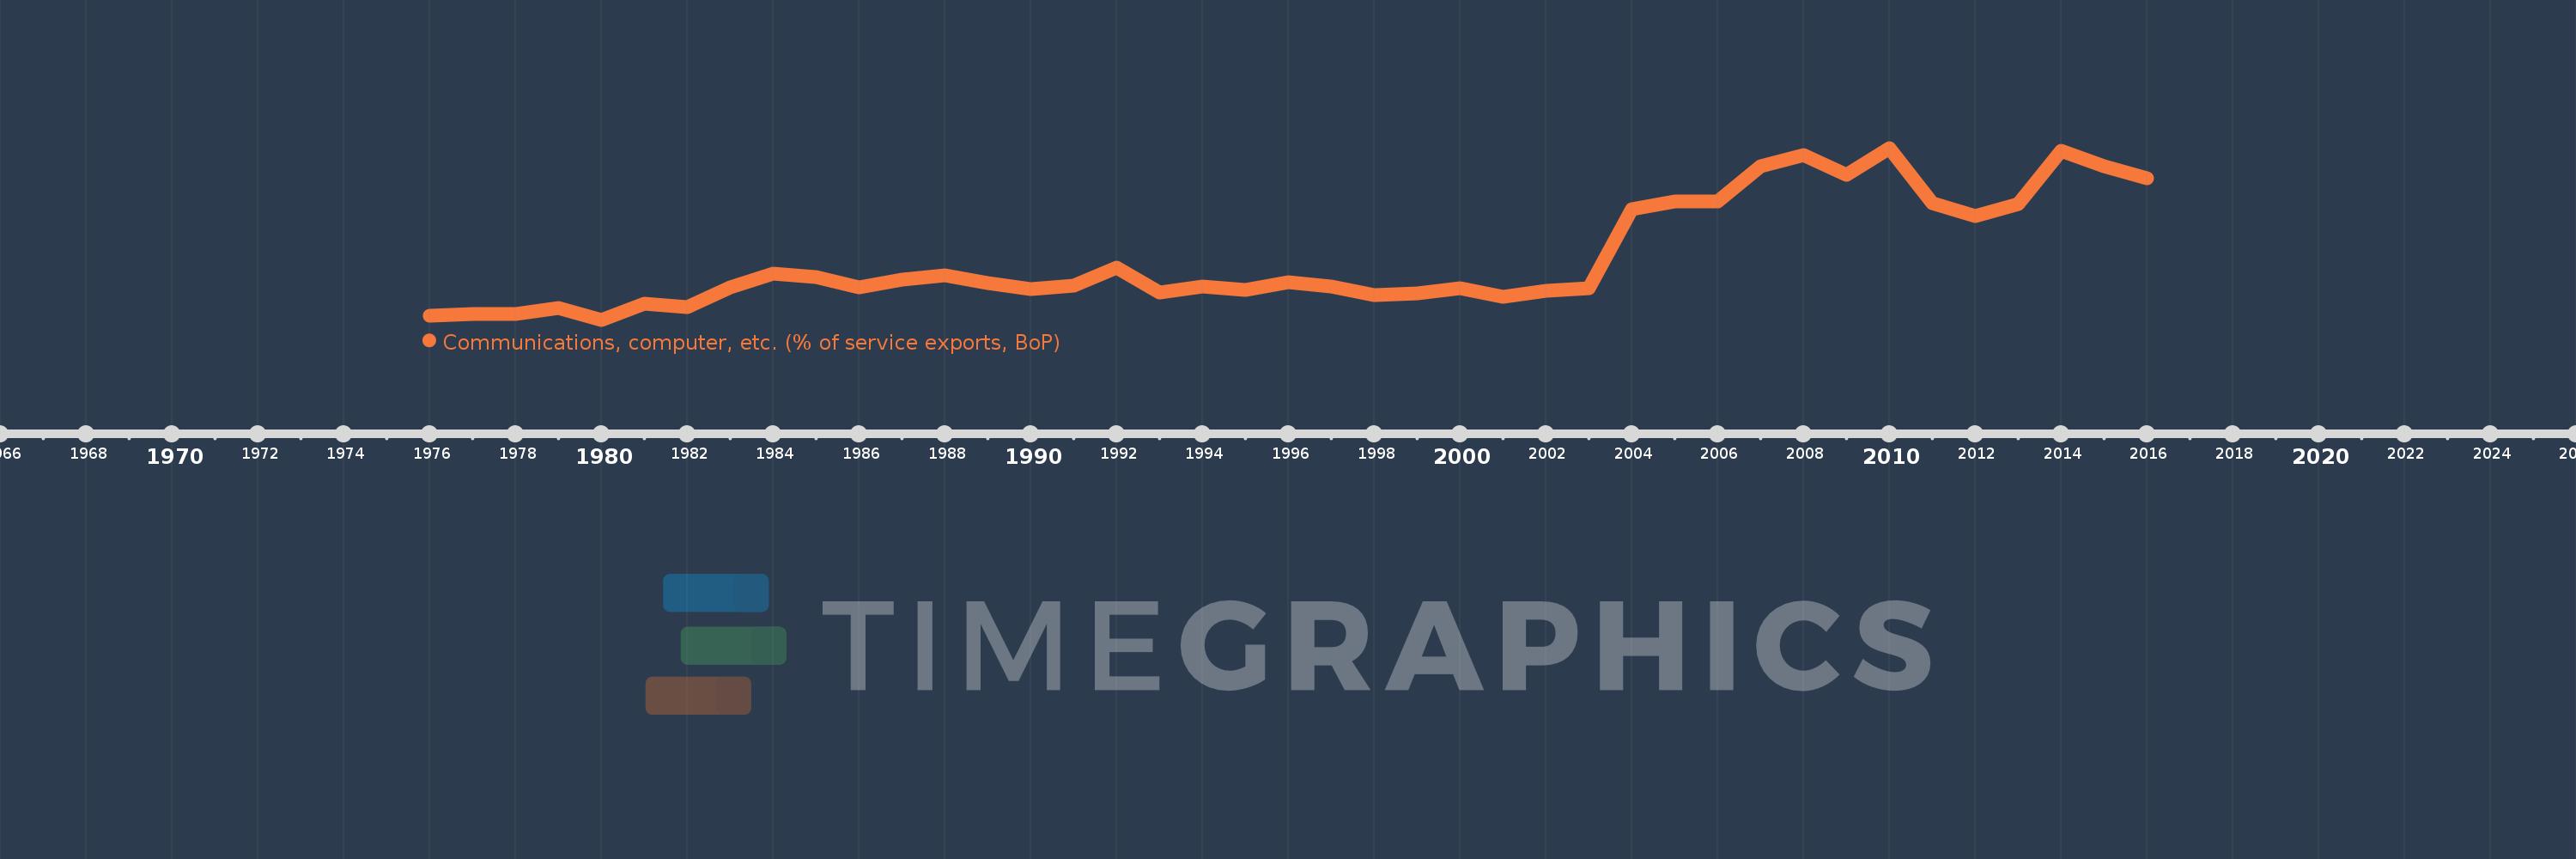
Communications, computer, etc. (% of service exports, BoP)
2016,2015,2014,2013,2012,2011,2010,2009,2008,2007,2006,2005,2004,2003,2002,2001,2000,1999,1998,1997,1996,1995,1994,1993,1992,1991,1990,1989,1988,1987,1986,1985,1984,1983,1982,1981,1980,1979,1978,1977,1976
This statistics in other country:
AfghanistanAlbaniaAlgeriaAngolaAntigua and BarbudaArab WorldArgentinaArmeniaArubaAustraliaAustriaAzerbaijanBahamas, TheBahrainBangladeshBarbadosBelarusBelgiumBelizeBeninBermudaBhutanBoliviaBosnia and HerzegovinaBotswanaBrazilBrunei DarussalamBulgariaBurkina FasoBurundiCabo VerdeCambodiaCameroonCanadaCaribbean small statesCentral African RepublicCentral Europe and the BalticsChadChileChinaColombiaComorosCongo, Dem. Rep.Congo, Rep.Costa RicaCote d'IvoireCroatiaCuracaoCyprusCzech RepublicDenmarkDjiboutiDominicaDominican RepublicEarly-demographic dividendEast Asia & PacificEast Asia & Pacific (excluding high income)East Asia & Pacific (IDA & IBRD countries)EcuadorEgypt, Arab Rep.El SalvadorEquatorial GuineaEritreaEstoniaEthiopiaEuro areaEurope & Central AsiaEurope & Central Asia (excluding high income)Europe & Central Asia (IDA & IBRD countries)European UnionFaroe IslandsFijiFinlandFragile and conflict affected situationsFranceFrench PolynesiaGabonGambia, TheGeorgiaGermanyGhanaGreeceGrenadaGuatemalaGuineaGuinea-BissauGuyanaHaitiHeavily indebted poor countries (HIPC)High incomeHondurasHong Kong SAR, ChinaHungaryIBRD onlyIcelandIDA & IBRD totalIDA onlyIDA totalIndiaIndonesiaIran, Islamic Rep.IraqIrelandIsraelItalyJamaicaJapanJordanKazakhstanKenyaKiribatiKorea, Rep.KosovoKuwaitKyrgyz RepublicLao PDRLate-demographic dividendLatin America & Caribbean Latin America & Caribbean (excluding high income)Latin America & the Caribbean (IDA & IBRD countries)LatviaLeast developed countries: UN classificationLebanonLesothoLiberiaLibyaLithuaniaLow & middle incomeLow incomeLower middle incomeLuxembourgMacao SAR, ChinaMacedonia, FYRMadagascarMalawiMalaysiaMaldivesMaliMaltaMarshall IslandsMauritaniaMauritiusMexicoMicronesia, Fed. Sts.Middle East & North AfricaMiddle East & North Africa (excluding high income)Middle East & North Africa (IDA & IBRD countries)Middle incomeMoldovaMongoliaMontenegroMoroccoMozambiqueMyanmarNamibiaNepalNetherlandsNew CaledoniaNew ZealandNicaraguaNigerNigeriaNorth AmericaNorwayOECD membersOmanOther small statesPacific island small statesPakistanPalauPanamaPapua New GuineaParaguayPeruPhilippinesPolandPortugalPost-demographic dividendPre-demographic dividendQatarRomaniaRussian FederationRwandaSamoaSao Tome and PrincipeSaudi ArabiaSenegalSerbiaSeychellesSierra LeoneSingaporeSint Maarten (Dutch part)Slovak RepublicSloveniaSmall statesSolomon IslandsSouth AfricaSouth AsiaSouth Asia (IDA & IBRD)South SudanSpainSri LankaSt. Kitts and NevisSt. LuciaSt. Vincent and the GrenadinesSub-Saharan Africa Sub-Saharan Africa (excluding high income)Sub-Saharan Africa (IDA & IBRD countries)SudanSurinameSwazilandSwedenSwitzerlandSyrian Arab RepublicTajikistanTanzaniaThailandTimor-LesteTogoTongaTrinidad and TobagoTunisiaTurkeyTuvaluUgandaUkraineUnited KingdomUnited StatesUpper middle incomeUruguayVanuatuVenezuela, RBWest Bank and GazaWorldYemen, Rep.ZambiaZimbabwe Timeline:
This timeline shows a graph from 1976 to 2016 of Kuwait. No data until 1975. Number of actual observations by date: 41.
Source name:
World Development Indicators
Source organization:
International Monetary Fund, Balance of Payments Statistics Yearbook and data files.
Categories, topics:
Economy & Growth, Trade
Last updated:
apr 23, 2017
Indicators value changes by year
Maximum:
65.078
jan 1, 2010
At the date of observation
Value
Absolute change
Change from previous value
jan 1, 1976
7.285
+7.285
0.0%
jan 1, 1977
7.821
+0.536
7.36%
jan 1, 1978
7.821
0.0
0.0%
jan 1, 1979
9.845
+2.023
25.87%
jan 1, 1980
5.81
-4.034
-40.98%
jan 1, 1981
11.48
+5.67
97.58%
jan 1, 1982
10.052
-1.429
-12.45%
jan 1, 1983
16.974
+6.923
68.87%
jan 1, 1984
21.739
+4.765
28.07%
jan 1, 1985
20.532
-1.207
-5.55%
jan 1, 1986
16.959
-3.573
-17.4%
jan 1, 1987
19.608
+2.649
15.62%
jan 1, 1988
21.254
+1.647
8.4%
jan 1, 1989
18.576
-2.679
-12.6%
jan 1, 1990
16.456
-2.12
-11.41%
jan 1, 1991
17.615
+1.159
7.05%
jan 1, 1992
23.759
+6.144
34.88%
jan 1, 1993
15.068
-8.69
-36.58%
jan 1, 1994
17.333
+2.265
15.03%
jan 1, 1995
15.952
-1.381
-7.97%
jan 1, 1996
18.667
+2.714
17.01%
jan 1, 1997
17.238
-1.429
-7.66%
jan 1, 1998
14.419
-2.818
-16.35%
jan 1, 1999
15.05
+0.631
4.37%
jan 1, 2000
16.831
+1.781
11.84%
jan 1, 2001
13.823
-3.008
-17.87%
jan 1, 2002
15.798
+1.974
14.28%
jan 1, 2003
16.71
+0.912
5.77%
jan 1, 2004
43.911
+27.201
162.78%
jan 1, 2005
46.639
+2.728
6.21%
jan 1, 2006
46.686
+0.047
0.1%
jan 1, 2007
58.756
+12.07
25.85%
jan 1, 2008
62.628
+3.872
6.59%
jan 1, 2009
55.768
-6.86
-10.95%
jan 1, 2010
65.078
+9.31
16.69%
jan 1, 2011
45.937
-19.141
-29.41%
jan 1, 2012
41.57
-4.367
-9.51%
jan 1, 2013
45.638
+4.068
9.79%
jan 1, 2014
64.088
+18.45
40.43%
jan 1, 2015
58.642
-5.446
-8.5%
jan 1, 2016
54.762
-3.88
-6.62%
Ranking of countries by current statistics by years


Comments: