29
/
en
AIzaSyAYiBZKx7MnpbEhh9jyipgxe19OcubqV5w
April 1, 2024
44120
Least developed countries: UN classification
LDC
false
2
1
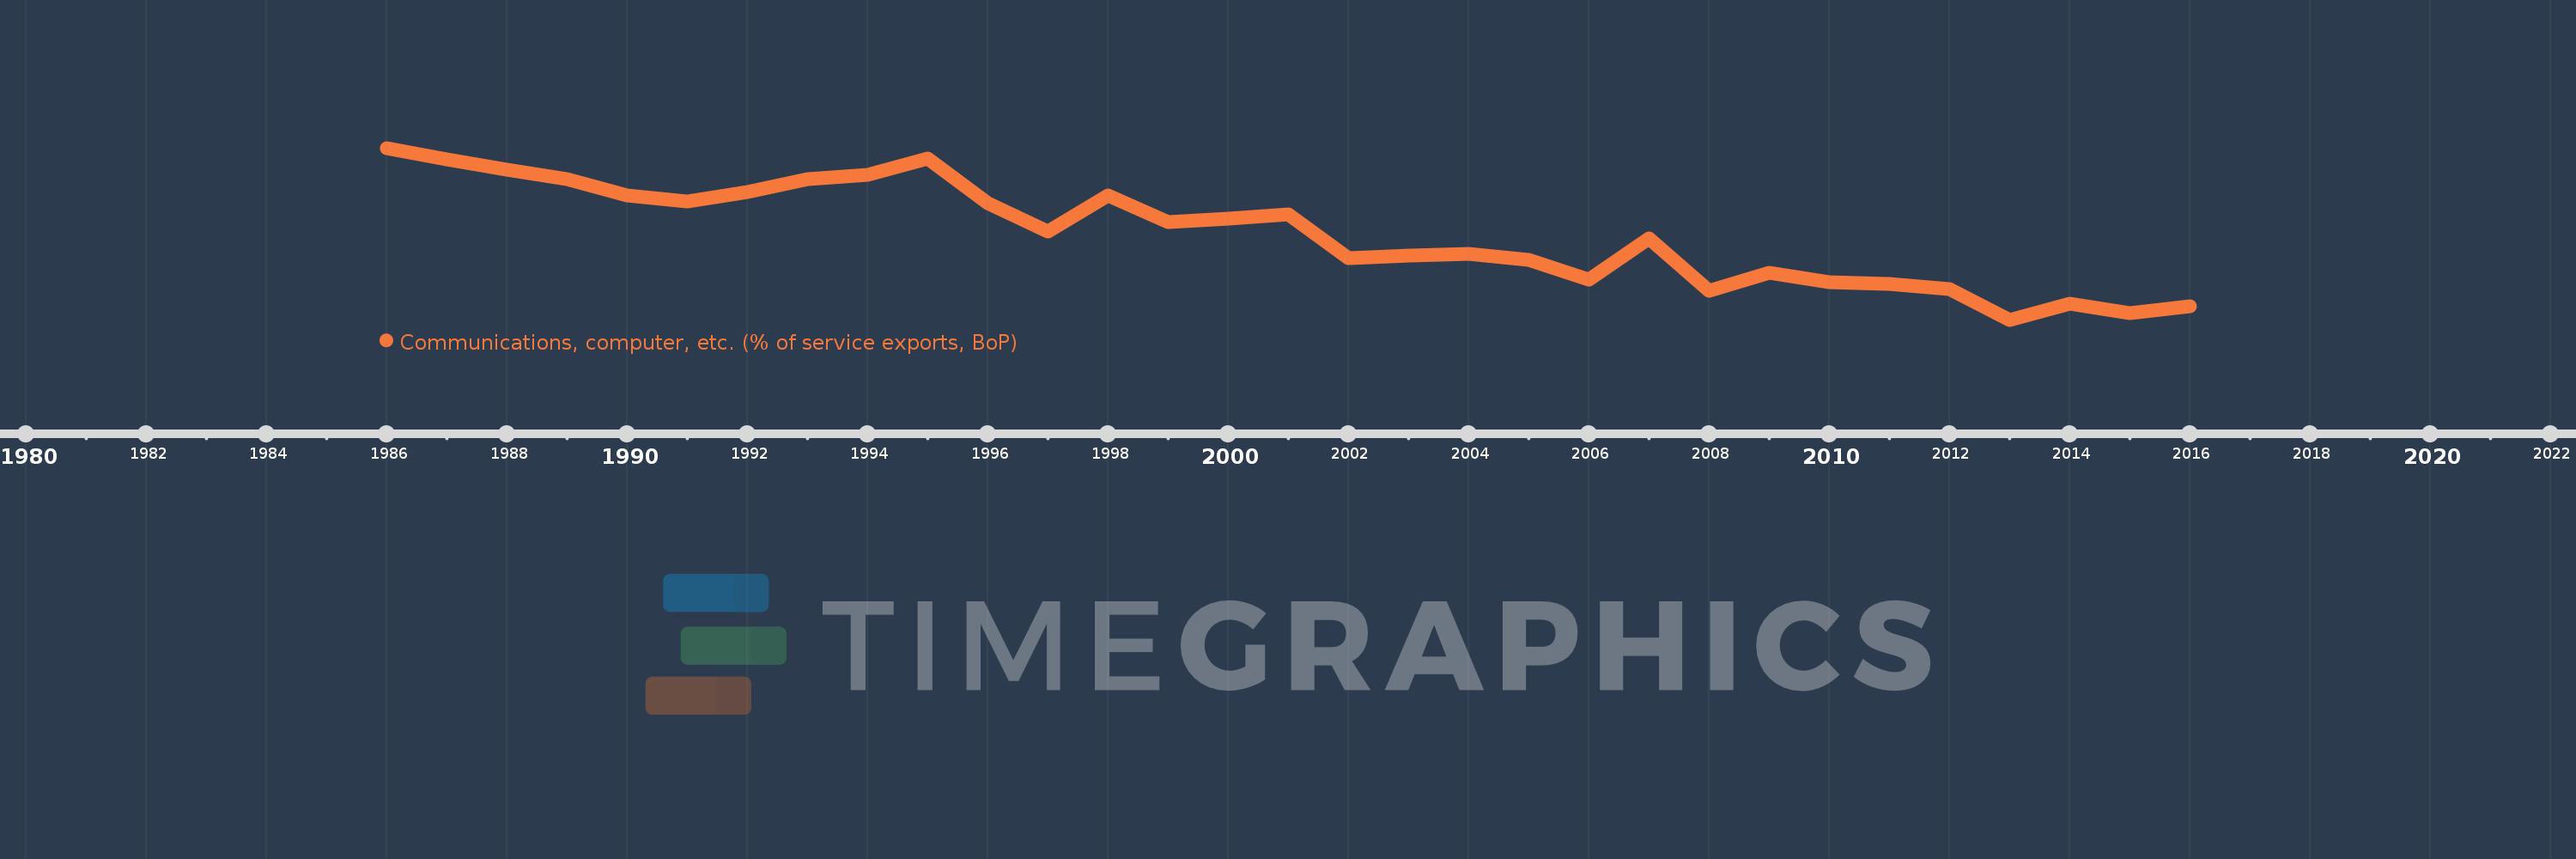
Communications, computer, etc. (% of service exports, BoP)
2016,2015,2014,2013,2012,2011,2010,2009,2008,2007,2006,2005,2004,2003,2002,2001,2000,1999,1998,1997,1996,1995,1994,1993,1992,1991,1990,1989,1988,1987,1986
This statistics in other country:
AfghanistanAlbaniaAlgeriaAngolaAntigua and BarbudaArab WorldArgentinaArmeniaArubaAustraliaAustriaAzerbaijanBahamas, TheBahrainBangladeshBarbadosBelarusBelgiumBelizeBeninBermudaBhutanBoliviaBosnia and HerzegovinaBotswanaBrazilBrunei DarussalamBulgariaBurkina FasoBurundiCabo VerdeCambodiaCameroonCanadaCaribbean small statesCentral African RepublicCentral Europe and the BalticsChadChileChinaColombiaComorosCongo, Dem. Rep.Congo, Rep.Costa RicaCote d'IvoireCroatiaCuracaoCyprusCzech RepublicDenmarkDjiboutiDominicaDominican RepublicEarly-demographic dividendEast Asia & PacificEast Asia & Pacific (excluding high income)East Asia & Pacific (IDA & IBRD countries)EcuadorEgypt, Arab Rep.El SalvadorEquatorial GuineaEritreaEstoniaEthiopiaEuro areaEurope & Central AsiaEurope & Central Asia (excluding high income)Europe & Central Asia (IDA & IBRD countries)European UnionFaroe IslandsFijiFinlandFragile and conflict affected situationsFranceFrench PolynesiaGabonGambia, TheGeorgiaGermanyGhanaGreeceGrenadaGuatemalaGuineaGuinea-BissauGuyanaHaitiHeavily indebted poor countries (HIPC)High incomeHondurasHong Kong SAR, ChinaHungaryIBRD onlyIcelandIDA & IBRD totalIDA onlyIDA totalIndiaIndonesiaIran, Islamic Rep.IraqIrelandIsraelItalyJamaicaJapanJordanKazakhstanKenyaKiribatiKorea, Rep.KosovoKuwaitKyrgyz RepublicLao PDRLate-demographic dividendLatin America & Caribbean Latin America & Caribbean (excluding high income)Latin America & the Caribbean (IDA & IBRD countries)LatviaLeast developed countries: UN classificationLebanonLesothoLiberiaLibyaLithuaniaLow & middle incomeLow incomeLower middle incomeLuxembourgMacao SAR, ChinaMacedonia, FYRMadagascarMalawiMalaysiaMaldivesMaliMaltaMarshall IslandsMauritaniaMauritiusMexicoMicronesia, Fed. Sts.Middle East & North AfricaMiddle East & North Africa (excluding high income)Middle East & North Africa (IDA & IBRD countries)Middle incomeMoldovaMongoliaMontenegroMoroccoMozambiqueMyanmarNamibiaNepalNetherlandsNew CaledoniaNew ZealandNicaraguaNigerNigeriaNorth AmericaNorwayOECD membersOmanOther small statesPacific island small statesPakistanPalauPanamaPapua New GuineaParaguayPeruPhilippinesPolandPortugalPost-demographic dividendPre-demographic dividendQatarRomaniaRussian FederationRwandaSamoaSao Tome and PrincipeSaudi ArabiaSenegalSerbiaSeychellesSierra LeoneSingaporeSint Maarten (Dutch part)Slovak RepublicSloveniaSmall statesSolomon IslandsSouth AfricaSouth AsiaSouth Asia (IDA & IBRD)South SudanSpainSri LankaSt. Kitts and NevisSt. LuciaSt. Vincent and the GrenadinesSub-Saharan Africa Sub-Saharan Africa (excluding high income)Sub-Saharan Africa (IDA & IBRD countries)SudanSurinameSwazilandSwedenSwitzerlandSyrian Arab RepublicTajikistanTanzaniaThailandTimor-LesteTogoTongaTrinidad and TobagoTunisiaTurkeyTuvaluUgandaUkraineUnited KingdomUnited StatesUpper middle incomeUruguayVanuatuVenezuela, RBWest Bank and GazaWorldYemen, Rep.ZambiaZimbabwe Timeline:
This timeline shows a graph from 1986 to 2016 of Least developed countries: UN classification. No data until 1985. Number of actual observations by date: 31.
Source name:
World Development Indicators
Source organization:
International Monetary Fund, Balance of Payments Statistics Yearbook and data files.
Categories, topics:
Economy & Growth, Trade
Last updated:
apr 23, 2017
Indicators value changes by year
Minimum:
32.942
jan 1, 2013
Maximum:
59.026
jan 1, 1986
At the date of observation
Value
Absolute change
Change from previous value
jan 1, 1986
59.026
+59.026
0.0%
jan 1, 1987
57.345
-1.681
-2.85%
jan 1, 1988
55.663
-1.682
-2.93%
jan 1, 1989
54.231
-1.432
-2.57%
jan 1, 1990
51.812
-2.419
-4.46%
jan 1, 1991
50.871
-0.941
-1.82%
jan 1, 1992
52.371
+1.5
2.95%
jan 1, 1993
54.306
+1.935
3.69%
jan 1, 1994
54.899
+0.593
1.09%
jan 1, 1995
57.453
+2.554
4.65%
jan 1, 1996
50.695
-6.757
-11.76%
jan 1, 1997
46.355
-4.341
-8.56%
jan 1, 1998
51.817
+5.462
11.78%
jan 1, 1999
47.745
-4.072
-7.86%
jan 1, 2000
48.267
+0.522
1.09%
jan 1, 2001
49.007
+0.74
1.53%
jan 1, 2002
42.344
-6.663
-13.6%
jan 1, 2003
42.677
+0.333
0.79%
jan 1, 2004
42.902
+0.225
0.53%
jan 1, 2005
41.978
-0.924
-2.15%
jan 1, 2006
38.978
-3.0
-7.15%
jan 1, 2007
45.302
+6.324
16.22%
jan 1, 2008
37.293
-8.009
-17.68%
jan 1, 2009
40.065
+2.772
7.43%
jan 1, 2010
38.585
-1.48
-3.69%
jan 1, 2011
38.352
-0.233
-0.6%
jan 1, 2012
37.583
-0.769
-2.0%
jan 1, 2013
32.942
-4.642
-12.35%
jan 1, 2014
35.407
+2.466
7.48%
jan 1, 2015
33.932
-1.475
-4.17%
jan 1, 2016
35.03
+1.098
3.23%
Ranking of countries by current statistics by years


Comments: