29
/
en
AIzaSyAYiBZKx7MnpbEhh9jyipgxe19OcubqV5w
April 1, 2024
59615
Sub-Saharan Africa (excluding high income)
SSA
false
2
1
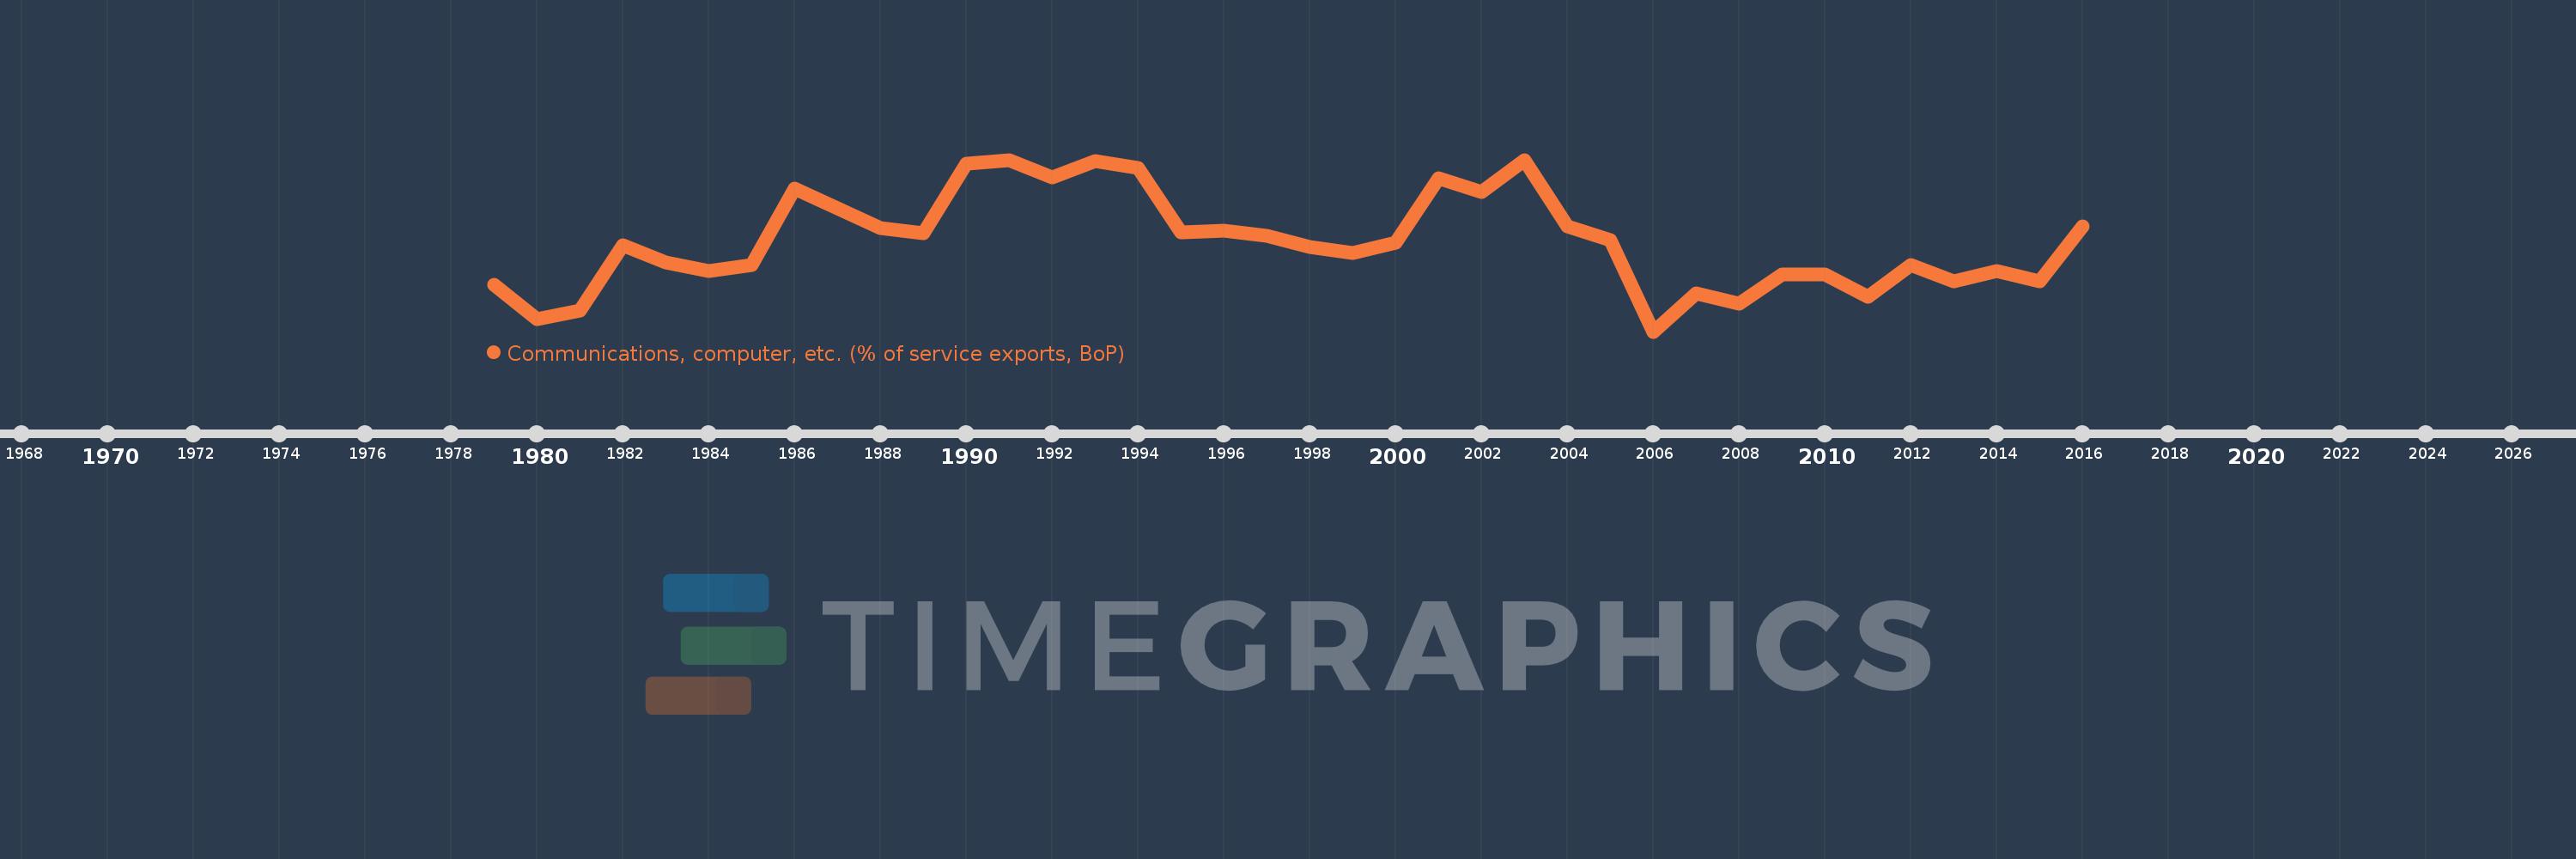
Communications, computer, etc. (% of service exports, BoP)
2016,2015,2014,2013,2012,2011,2010,2009,2008,2007,2006,2005,2004,2003,2002,2001,2000,1999,1998,1997,1996,1995,1994,1993,1992,1991,1990,1989,1988,1986,1985,1984,1983,1982,1981,1980,1979
This statistics in other country:
AfghanistanAlbaniaAlgeriaAngolaAntigua and BarbudaArab WorldArgentinaArmeniaArubaAustraliaAustriaAzerbaijanBahamas, TheBahrainBangladeshBarbadosBelarusBelgiumBelizeBeninBermudaBhutanBoliviaBosnia and HerzegovinaBotswanaBrazilBrunei DarussalamBulgariaBurkina FasoBurundiCabo VerdeCambodiaCameroonCanadaCaribbean small statesCentral African RepublicCentral Europe and the BalticsChadChileChinaColombiaComorosCongo, Dem. Rep.Congo, Rep.Costa RicaCote d'IvoireCroatiaCuracaoCyprusCzech RepublicDenmarkDjiboutiDominicaDominican RepublicEarly-demographic dividendEast Asia & PacificEast Asia & Pacific (excluding high income)East Asia & Pacific (IDA & IBRD countries)EcuadorEgypt, Arab Rep.El SalvadorEquatorial GuineaEritreaEstoniaEthiopiaEuro areaEurope & Central AsiaEurope & Central Asia (excluding high income)Europe & Central Asia (IDA & IBRD countries)European UnionFaroe IslandsFijiFinlandFragile and conflict affected situationsFranceFrench PolynesiaGabonGambia, TheGeorgiaGermanyGhanaGreeceGrenadaGuatemalaGuineaGuinea-BissauGuyanaHaitiHeavily indebted poor countries (HIPC)High incomeHondurasHong Kong SAR, ChinaHungaryIBRD onlyIcelandIDA & IBRD totalIDA onlyIDA totalIndiaIndonesiaIran, Islamic Rep.IraqIrelandIsraelItalyJamaicaJapanJordanKazakhstanKenyaKiribatiKorea, Rep.KosovoKuwaitKyrgyz RepublicLao PDRLate-demographic dividendLatin America & Caribbean Latin America & Caribbean (excluding high income)Latin America & the Caribbean (IDA & IBRD countries)LatviaLeast developed countries: UN classificationLebanonLesothoLiberiaLibyaLithuaniaLow & middle incomeLow incomeLower middle incomeLuxembourgMacao SAR, ChinaMacedonia, FYRMadagascarMalawiMalaysiaMaldivesMaliMaltaMarshall IslandsMauritaniaMauritiusMexicoMicronesia, Fed. Sts.Middle East & North AfricaMiddle East & North Africa (excluding high income)Middle East & North Africa (IDA & IBRD countries)Middle incomeMoldovaMongoliaMontenegroMoroccoMozambiqueMyanmarNamibiaNepalNetherlandsNew CaledoniaNew ZealandNicaraguaNigerNigeriaNorth AmericaNorwayOECD membersOmanOther small statesPacific island small statesPakistanPalauPanamaPapua New GuineaParaguayPeruPhilippinesPolandPortugalPost-demographic dividendPre-demographic dividendQatarRomaniaRussian FederationRwandaSamoaSao Tome and PrincipeSaudi ArabiaSenegalSerbiaSeychellesSierra LeoneSingaporeSint Maarten (Dutch part)Slovak RepublicSloveniaSmall statesSolomon IslandsSouth AfricaSouth AsiaSouth Asia (IDA & IBRD)South SudanSpainSri LankaSt. Kitts and NevisSt. LuciaSt. Vincent and the GrenadinesSub-Saharan Africa Sub-Saharan Africa (excluding high income)Sub-Saharan Africa (IDA & IBRD countries)SudanSurinameSwazilandSwedenSwitzerlandSyrian Arab RepublicTajikistanTanzaniaThailandTimor-LesteTogoTongaTrinidad and TobagoTunisiaTurkeyTuvaluUgandaUkraineUnited KingdomUnited StatesUpper middle incomeUruguayVanuatuVenezuela, RBWest Bank and GazaWorldYemen, Rep.ZambiaZimbabwe Timeline:
This timeline shows a graph from 1979 to 2016 of Sub-Saharan Africa (excluding high income). No data until 1978. Number of actual observations by date: 37.
Source name:
World Development Indicators
Source organization:
International Monetary Fund, Balance of Payments Statistics Yearbook and data files.
Categories, topics:
Economy & Growth, Trade
Last updated:
apr 23, 2017
Indicators value changes by year
Minimum:
22.749
jan 1, 2006
Maximum:
36.503
jan 1, 2003
At the date of observation
Value
Absolute change
Change from previous value
jan 1, 1979
26.468
+26.468
0.0%
jan 1, 1980
23.729
-2.739
-10.35%
jan 1, 1981
24.414
+0.685
2.89%
jan 1, 1982
29.693
+5.279
21.62%
jan 1, 1983
28.277
-1.416
-4.77%
jan 1, 1984
27.61
-0.667
-2.36%
jan 1, 1985
28.09
+0.481
1.74%
jan 1, 1986
34.178
+6.088
21.67%
jan 1, 1988
31.027
-3.151
-9.22%
jan 1, 1989
30.625
-0.402
-1.3%
jan 1, 1990
36.168
+5.543
18.1%
jan 1, 1991
36.444
+0.276
0.76%
jan 1, 1992
35.12
-1.324
-3.63%
jan 1, 1993
36.422
+1.302
3.71%
jan 1, 1994
35.863
-0.559
-1.54%
jan 1, 1995
30.691
-5.172
-14.42%
jan 1, 1996
30.85
+0.158
0.52%
jan 1, 1997
30.384
-0.466
-1.51%
jan 1, 1998
29.516
-0.868
-2.86%
jan 1, 1999
29.039
-0.477
-1.62%
jan 1, 2000
29.837
+0.798
2.75%
jan 1, 2001
35.016
+5.179
17.36%
jan 1, 2002
33.936
-1.08
-3.09%
jan 1, 2003
36.503
+2.567
7.56%
jan 1, 2004
31.168
-5.335
-14.61%
jan 1, 2005
30.095
-1.074
-3.44%
jan 1, 2006
22.749
-7.346
-24.41%
jan 1, 2007
25.821
+3.073
13.51%
jan 1, 2008
24.972
-0.85
-3.29%
jan 1, 2009
27.308
+2.336
9.36%
jan 1, 2010
27.31
+0.002
0.01%
jan 1, 2011
25.558
-1.752
-6.42%
jan 1, 2012
28.105
+2.547
9.97%
jan 1, 2013
26.74
-1.365
-4.86%
jan 1, 2014
27.584
+0.844
3.16%
jan 1, 2015
26.773
-0.811
-2.94%
jan 1, 2016
31.2
+4.428
16.54%
Ranking of countries by current statistics by years


Comments: