29
/
en
AIzaSyAYiBZKx7MnpbEhh9jyipgxe19OcubqV5w
April 1, 2024
79277
Barbados
BRB
true
2
1
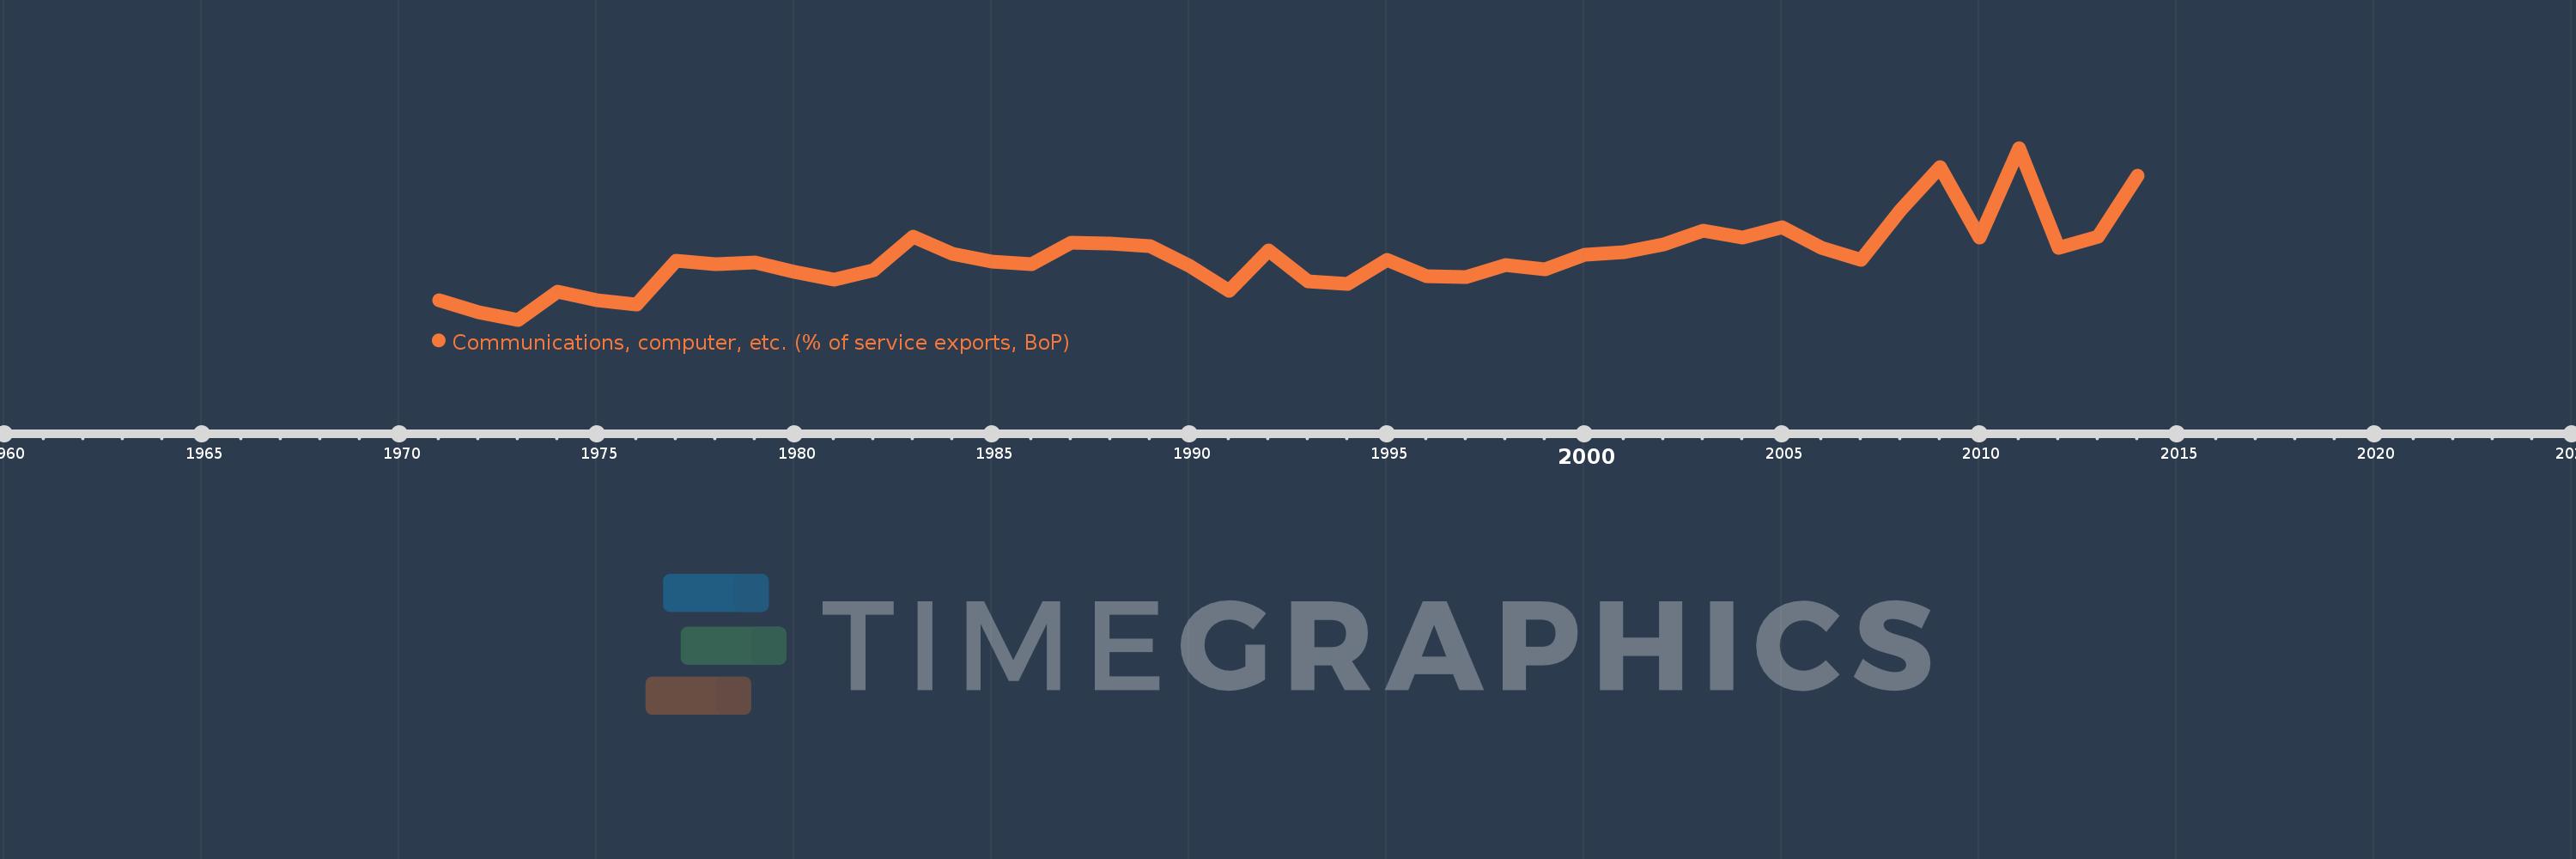
Communications, computer, etc. (% of service exports, BoP)
2014,2013,2012,2011,2010,2009,2008,2007,2006,2005,2004,2003,2002,2001,2000,1999,1998,1997,1996,1995,1994,1993,1992,1991,1990,1989,1988,1987,1986,1985,1984,1983,1982,1981,1980,1979,1978,1977,1976,1975,1974,1973,1972,1971
This statistics in other country:
AfghanistanAlbaniaAlgeriaAngolaAntigua and BarbudaArab WorldArgentinaArmeniaArubaAustraliaAustriaAzerbaijanBahamas, TheBahrainBangladeshBarbadosBelarusBelgiumBelizeBeninBermudaBhutanBoliviaBosnia and HerzegovinaBotswanaBrazilBrunei DarussalamBulgariaBurkina FasoBurundiCabo VerdeCambodiaCameroonCanadaCaribbean small statesCentral African RepublicCentral Europe and the BalticsChadChileChinaColombiaComorosCongo, Dem. Rep.Congo, Rep.Costa RicaCote d'IvoireCroatiaCuracaoCyprusCzech RepublicDenmarkDjiboutiDominicaDominican RepublicEarly-demographic dividendEast Asia & PacificEast Asia & Pacific (excluding high income)East Asia & Pacific (IDA & IBRD countries)EcuadorEgypt, Arab Rep.El SalvadorEquatorial GuineaEritreaEstoniaEthiopiaEuro areaEurope & Central AsiaEurope & Central Asia (excluding high income)Europe & Central Asia (IDA & IBRD countries)European UnionFaroe IslandsFijiFinlandFragile and conflict affected situationsFranceFrench PolynesiaGabonGambia, TheGeorgiaGermanyGhanaGreeceGrenadaGuatemalaGuineaGuinea-BissauGuyanaHaitiHeavily indebted poor countries (HIPC)High incomeHondurasHong Kong SAR, ChinaHungaryIBRD onlyIcelandIDA & IBRD totalIDA onlyIDA totalIndiaIndonesiaIran, Islamic Rep.IraqIrelandIsraelItalyJamaicaJapanJordanKazakhstanKenyaKiribatiKorea, Rep.KosovoKuwaitKyrgyz RepublicLao PDRLate-demographic dividendLatin America & Caribbean Latin America & Caribbean (excluding high income)Latin America & the Caribbean (IDA & IBRD countries)LatviaLeast developed countries: UN classificationLebanonLesothoLiberiaLibyaLithuaniaLow & middle incomeLow incomeLower middle incomeLuxembourgMacao SAR, ChinaMacedonia, FYRMadagascarMalawiMalaysiaMaldivesMaliMaltaMarshall IslandsMauritaniaMauritiusMexicoMicronesia, Fed. Sts.Middle East & North AfricaMiddle East & North Africa (excluding high income)Middle East & North Africa (IDA & IBRD countries)Middle incomeMoldovaMongoliaMontenegroMoroccoMozambiqueMyanmarNamibiaNepalNetherlandsNew CaledoniaNew ZealandNicaraguaNigerNigeriaNorth AmericaNorwayOECD membersOmanOther small statesPacific island small statesPakistanPalauPanamaPapua New GuineaParaguayPeruPhilippinesPolandPortugalPost-demographic dividendPre-demographic dividendQatarRomaniaRussian FederationRwandaSamoaSao Tome and PrincipeSaudi ArabiaSenegalSerbiaSeychellesSierra LeoneSingaporeSint Maarten (Dutch part)Slovak RepublicSloveniaSmall statesSolomon IslandsSouth AfricaSouth AsiaSouth Asia (IDA & IBRD)South SudanSpainSri LankaSt. Kitts and NevisSt. LuciaSt. Vincent and the GrenadinesSub-Saharan Africa Sub-Saharan Africa (excluding high income)Sub-Saharan Africa (IDA & IBRD countries)SudanSurinameSwazilandSwedenSwitzerlandSyrian Arab RepublicTajikistanTanzaniaThailandTimor-LesteTogoTongaTrinidad and TobagoTunisiaTurkeyTuvaluUgandaUkraineUnited KingdomUnited StatesUpper middle incomeUruguayVanuatuVenezuela, RBWest Bank and GazaWorldYemen, Rep.ZambiaZimbabwe Timeline:
This timeline shows a graph from 1971 to 2014 of Barbados. No data until 1970. Number of actual observations by date: 44.
Source name:
World Development Indicators
Source organization:
International Monetary Fund, Balance of Payments Statistics Yearbook and data files.
Categories, topics:
Economy & Growth, Trade
Last updated:
apr 23, 2017
Indicators value changes by year
Maximum:
28.612
jan 1, 2011
At the date of observation
Value
Absolute change
Change from previous value
jan 1, 1971
11.82
+11.82
0.0%
jan 1, 1972
10.483
-1.337
-11.31%
jan 1, 1973
9.673
-0.81
-7.73%
jan 1, 1974
12.762
+3.089
31.94%
jan 1, 1975
11.777
-0.985
-7.72%
jan 1, 1976
11.378
-0.4
-3.39%
jan 1, 1977
16.216
+4.839
42.53%
jan 1, 1978
15.826
-0.39
-2.41%
jan 1, 1979
16.008
+0.182
1.15%
jan 1, 1980
14.954
-1.054
-6.58%
jan 1, 1981
14.135
-0.819
-5.48%
jan 1, 1982
15.092
+0.958
6.78%
jan 1, 1983
18.793
+3.701
24.52%
jan 1, 1984
16.894
-1.9
-10.11%
jan 1, 1985
16.054
-0.839
-4.97%
jan 1, 1986
15.831
-0.224
-1.39%
jan 1, 1987
18.12
+2.289
14.46%
jan 1, 1988
18.029
-0.09
-0.5%
jan 1, 1989
17.769
-0.261
-1.45%
jan 1, 1990
15.627
-2.142
-12.05%
jan 1, 1991
12.824
-2.803
-17.94%
jan 1, 1992
17.325
+4.501
35.1%
jan 1, 1993
13.939
-3.386
-19.54%
jan 1, 1994
13.619
-0.32
-2.29%
jan 1, 1995
16.245
+2.626
19.28%
jan 1, 1996
14.486
-1.759
-10.83%
jan 1, 1997
14.361
-0.125
-0.86%
jan 1, 1998
15.744
+1.383
9.63%
jan 1, 1999
15.251
-0.493
-3.13%
jan 1, 2000
16.878
+1.627
10.67%
jan 1, 2001
17.165
+0.287
1.7%
jan 1, 2002
18.006
+0.84
4.9%
jan 1, 2003
19.463
+1.458
8.09%
jan 1, 2004
18.728
-0.735
-3.78%
jan 1, 2005
19.888
+1.159
6.19%
jan 1, 2006
17.591
-2.296
-11.55%
jan 1, 2007
16.297
-1.294
-7.36%
jan 1, 2008
21.775
+5.477
33.61%
jan 1, 2009
26.461
+4.687
21.52%
jan 1, 2010
18.741
-7.721
-29.18%
jan 1, 2011
28.612
+9.872
52.67%
jan 1, 2012
17.645
-10.967
-38.33%
jan 1, 2013
18.818
+1.173
6.65%
jan 1, 2014
25.597
+6.779
36.02%
Ranking of countries by current statistics by years


Comments: