29
/
en
AIzaSyAYiBZKx7MnpbEhh9jyipgxe19OcubqV5w
April 1, 2024
61437
Upper middle income
UMC
false
2
1
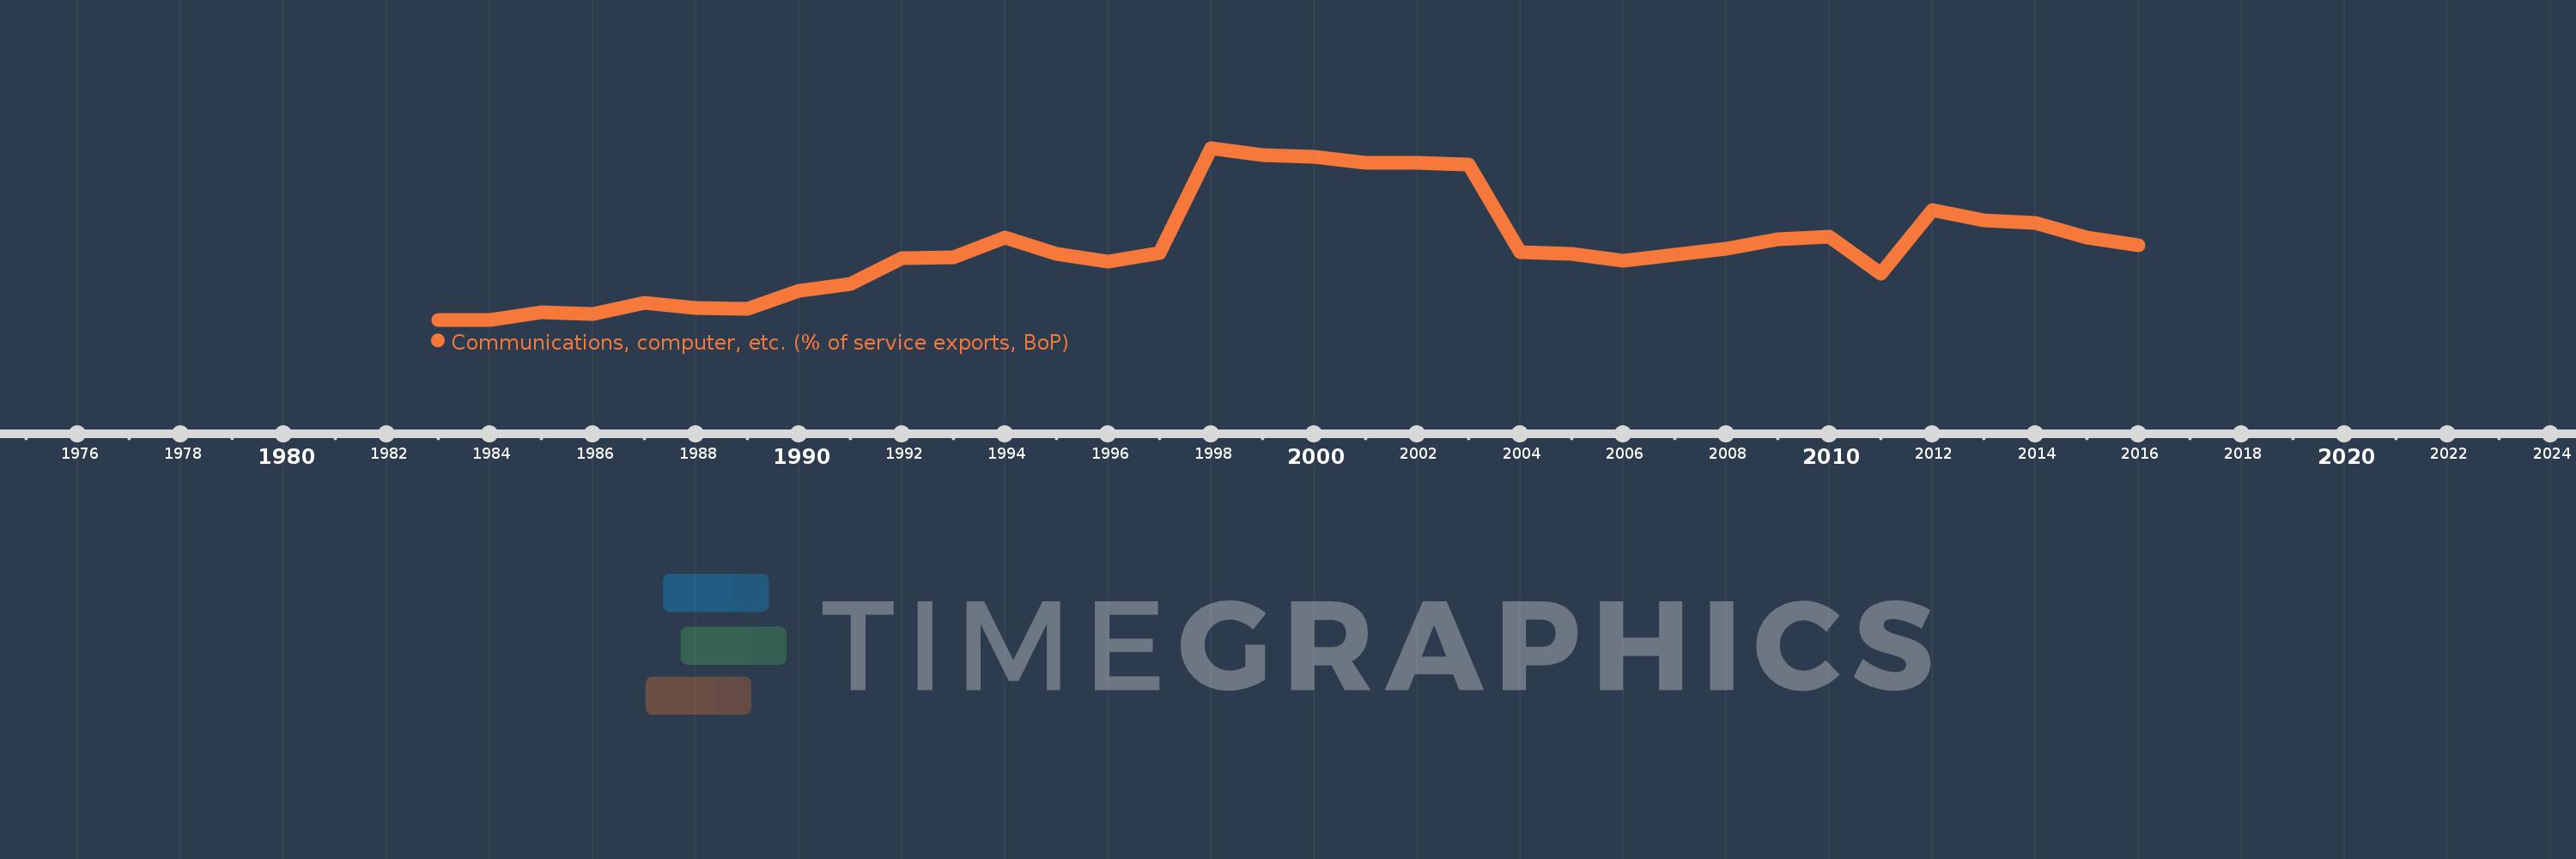
Communications, computer, etc. (% of service exports, BoP)
2016,2015,2014,2013,2012,2011,2010,2009,2008,2007,2006,2005,2004,2003,2002,2001,2000,1999,1998,1997,1996,1995,1994,1993,1992,1991,1990,1989,1988,1987,1986,1985,1984,1983
This statistics in other country:
AfghanistanAlbaniaAlgeriaAngolaAntigua and BarbudaArab WorldArgentinaArmeniaArubaAustraliaAustriaAzerbaijanBahamas, TheBahrainBangladeshBarbadosBelarusBelgiumBelizeBeninBermudaBhutanBoliviaBosnia and HerzegovinaBotswanaBrazilBrunei DarussalamBulgariaBurkina FasoBurundiCabo VerdeCambodiaCameroonCanadaCaribbean small statesCentral African RepublicCentral Europe and the BalticsChadChileChinaColombiaComorosCongo, Dem. Rep.Congo, Rep.Costa RicaCote d'IvoireCroatiaCuracaoCyprusCzech RepublicDenmarkDjiboutiDominicaDominican RepublicEarly-demographic dividendEast Asia & PacificEast Asia & Pacific (excluding high income)East Asia & Pacific (IDA & IBRD countries)EcuadorEgypt, Arab Rep.El SalvadorEquatorial GuineaEritreaEstoniaEthiopiaEuro areaEurope & Central AsiaEurope & Central Asia (excluding high income)Europe & Central Asia (IDA & IBRD countries)European UnionFaroe IslandsFijiFinlandFragile and conflict affected situationsFranceFrench PolynesiaGabonGambia, TheGeorgiaGermanyGhanaGreeceGrenadaGuatemalaGuineaGuinea-BissauGuyanaHaitiHeavily indebted poor countries (HIPC)High incomeHondurasHong Kong SAR, ChinaHungaryIBRD onlyIcelandIDA & IBRD totalIDA onlyIDA totalIndiaIndonesiaIran, Islamic Rep.IraqIrelandIsraelItalyJamaicaJapanJordanKazakhstanKenyaKiribatiKorea, Rep.KosovoKuwaitKyrgyz RepublicLao PDRLate-demographic dividendLatin America & Caribbean Latin America & Caribbean (excluding high income)Latin America & the Caribbean (IDA & IBRD countries)LatviaLeast developed countries: UN classificationLebanonLesothoLiberiaLibyaLithuaniaLow & middle incomeLow incomeLower middle incomeLuxembourgMacao SAR, ChinaMacedonia, FYRMadagascarMalawiMalaysiaMaldivesMaliMaltaMarshall IslandsMauritaniaMauritiusMexicoMicronesia, Fed. Sts.Middle East & North AfricaMiddle East & North Africa (excluding high income)Middle East & North Africa (IDA & IBRD countries)Middle incomeMoldovaMongoliaMontenegroMoroccoMozambiqueMyanmarNamibiaNepalNetherlandsNew CaledoniaNew ZealandNicaraguaNigerNigeriaNorth AmericaNorwayOECD membersOmanOther small statesPacific island small statesPakistanPalauPanamaPapua New GuineaParaguayPeruPhilippinesPolandPortugalPost-demographic dividendPre-demographic dividendQatarRomaniaRussian FederationRwandaSamoaSao Tome and PrincipeSaudi ArabiaSenegalSerbiaSeychellesSierra LeoneSingaporeSint Maarten (Dutch part)Slovak RepublicSloveniaSmall statesSolomon IslandsSouth AfricaSouth AsiaSouth Asia (IDA & IBRD)South SudanSpainSri LankaSt. Kitts and NevisSt. LuciaSt. Vincent and the GrenadinesSub-Saharan Africa Sub-Saharan Africa (excluding high income)Sub-Saharan Africa (IDA & IBRD countries)SudanSurinameSwazilandSwedenSwitzerlandSyrian Arab RepublicTajikistanTanzaniaThailandTimor-LesteTogoTongaTrinidad and TobagoTunisiaTurkeyTuvaluUgandaUkraineUnited KingdomUnited StatesUpper middle incomeUruguayVanuatuVenezuela, RBWest Bank and GazaWorldYemen, Rep.ZambiaZimbabwe Timeline:
This timeline shows a graph from 1983 to 2016 of Upper middle income. No data until 1982. Number of actual observations by date: 34.
Source name:
World Development Indicators
Source organization:
International Monetary Fund, Balance of Payments Statistics Yearbook and data files.
Categories, topics:
Economy & Growth, Trade
Last updated:
apr 23, 2017
Indicators value changes by year
Minimum:
24.119
jan 1, 1984
Maximum:
50.211
jan 1, 1998
At the date of observation
Value
Absolute change
Change from previous value
jan 1, 1983
24.145
+24.145
0.0%
jan 1, 1984
24.119
-0.026
-0.11%
jan 1, 1985
25.201
+1.083
4.49%
jan 1, 1986
25.01
-0.191
-0.76%
jan 1, 1987
26.672
+1.662
6.65%
jan 1, 1988
25.949
-0.723
-2.71%
jan 1, 1989
25.826
-0.123
-0.47%
jan 1, 1990
28.473
+2.647
10.25%
jan 1, 1991
29.61
+1.136
3.99%
jan 1, 1992
33.441
+3.832
12.94%
jan 1, 1993
33.548
+0.107
0.32%
jan 1, 1994
36.548
+3.0
8.94%
jan 1, 1995
34.13
-2.418
-6.62%
jan 1, 1996
32.914
-1.216
-3.56%
jan 1, 1997
34.212
+1.298
3.94%
jan 1, 1998
50.211
+15.999
46.76%
jan 1, 1999
49.095
-1.116
-2.22%
jan 1, 2000
48.919
-0.176
-0.36%
jan 1, 2001
47.997
-0.923
-1.89%
jan 1, 2002
47.934
-0.063
-0.13%
jan 1, 2003
47.754
-0.18
-0.37%
jan 1, 2004
34.415
-13.339
-27.93%
jan 1, 2005
34.182
-0.233
-0.68%
jan 1, 2006
33.134
-1.048
-3.06%
jan 1, 2007
33.935
+0.801
2.42%
jan 1, 2008
34.889
+0.954
2.81%
jan 1, 2009
36.335
+1.446
4.14%
jan 1, 2010
36.791
+0.456
1.26%
jan 1, 2011
31.126
-5.665
-15.4%
jan 1, 2012
40.823
+9.697
31.15%
jan 1, 2013
39.208
-1.615
-3.96%
jan 1, 2014
38.825
-0.382
-0.98%
jan 1, 2015
36.634
-2.191
-5.64%
jan 1, 2016
35.459
-1.175
-3.21%
Ranking of countries by current statistics by years


Comments: