29
/
en
AIzaSyAYiBZKx7MnpbEhh9jyipgxe19OcubqV5w
April 1, 2024
29727
Euro area
EMU
false
2
1
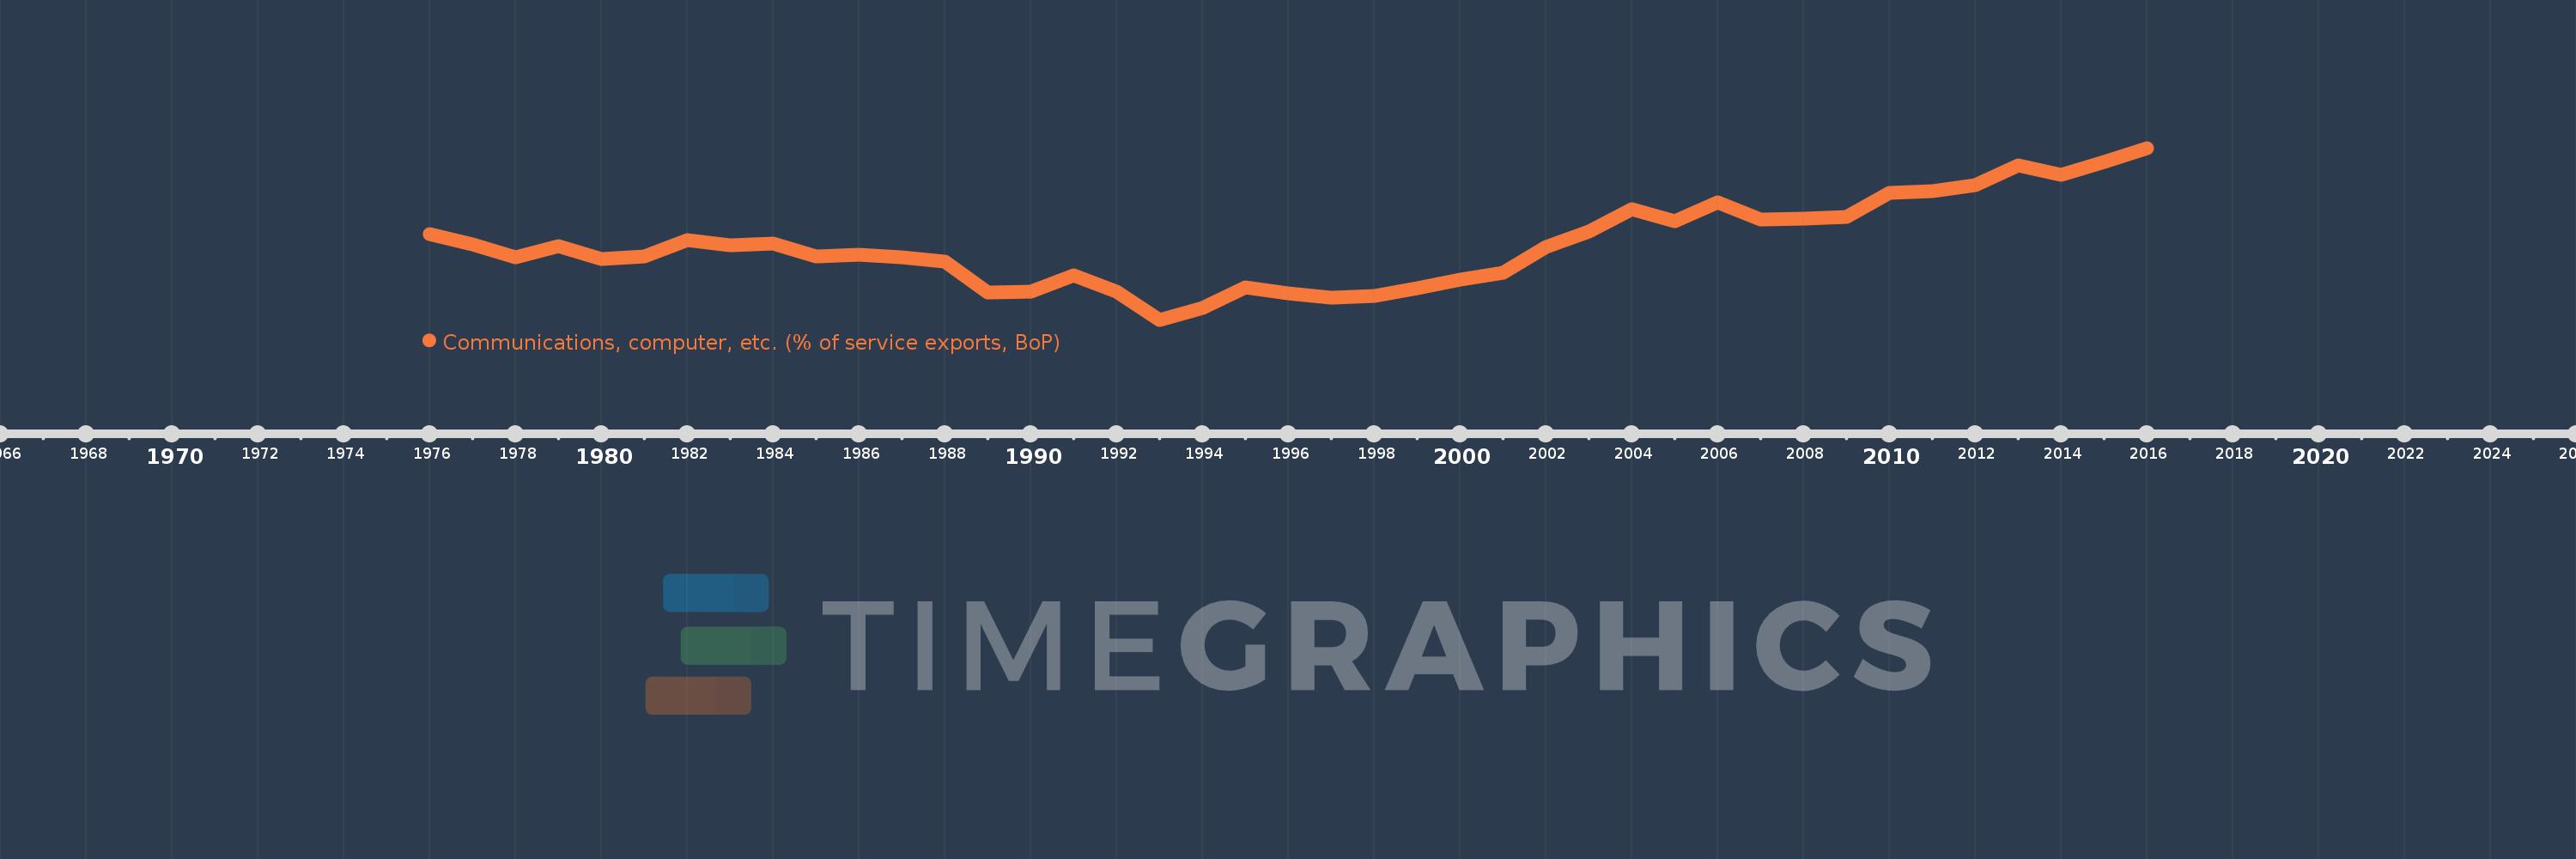
Communications, computer, etc. (% of service exports, BoP)
2016,2015,2014,2013,2012,2011,2010,2009,2008,2007,2006,2005,2004,2003,2002,2001,2000,1999,1998,1997,1996,1995,1994,1993,1992,1991,1990,1989,1988,1987,1986,1985,1984,1983,1982,1981,1980,1979,1978,1977,1976
This statistics in other country:
AfghanistanAlbaniaAlgeriaAngolaAntigua and BarbudaArab WorldArgentinaArmeniaArubaAustraliaAustriaAzerbaijanBahamas, TheBahrainBangladeshBarbadosBelarusBelgiumBelizeBeninBermudaBhutanBoliviaBosnia and HerzegovinaBotswanaBrazilBrunei DarussalamBulgariaBurkina FasoBurundiCabo VerdeCambodiaCameroonCanadaCaribbean small statesCentral African RepublicCentral Europe and the BalticsChadChileChinaColombiaComorosCongo, Dem. Rep.Congo, Rep.Costa RicaCote d'IvoireCroatiaCuracaoCyprusCzech RepublicDenmarkDjiboutiDominicaDominican RepublicEarly-demographic dividendEast Asia & PacificEast Asia & Pacific (excluding high income)East Asia & Pacific (IDA & IBRD countries)EcuadorEgypt, Arab Rep.El SalvadorEquatorial GuineaEritreaEstoniaEthiopiaEuro areaEurope & Central AsiaEurope & Central Asia (excluding high income)Europe & Central Asia (IDA & IBRD countries)European UnionFaroe IslandsFijiFinlandFragile and conflict affected situationsFranceFrench PolynesiaGabonGambia, TheGeorgiaGermanyGhanaGreeceGrenadaGuatemalaGuineaGuinea-BissauGuyanaHaitiHeavily indebted poor countries (HIPC)High incomeHondurasHong Kong SAR, ChinaHungaryIBRD onlyIcelandIDA & IBRD totalIDA onlyIDA totalIndiaIndonesiaIran, Islamic Rep.IraqIrelandIsraelItalyJamaicaJapanJordanKazakhstanKenyaKiribatiKorea, Rep.KosovoKuwaitKyrgyz RepublicLao PDRLate-demographic dividendLatin America & Caribbean Latin America & Caribbean (excluding high income)Latin America & the Caribbean (IDA & IBRD countries)LatviaLeast developed countries: UN classificationLebanonLesothoLiberiaLibyaLithuaniaLow & middle incomeLow incomeLower middle incomeLuxembourgMacao SAR, ChinaMacedonia, FYRMadagascarMalawiMalaysiaMaldivesMaliMaltaMarshall IslandsMauritaniaMauritiusMexicoMicronesia, Fed. Sts.Middle East & North AfricaMiddle East & North Africa (excluding high income)Middle East & North Africa (IDA & IBRD countries)Middle incomeMoldovaMongoliaMontenegroMoroccoMozambiqueMyanmarNamibiaNepalNetherlandsNew CaledoniaNew ZealandNicaraguaNigerNigeriaNorth AmericaNorwayOECD membersOmanOther small statesPacific island small statesPakistanPalauPanamaPapua New GuineaParaguayPeruPhilippinesPolandPortugalPost-demographic dividendPre-demographic dividendQatarRomaniaRussian FederationRwandaSamoaSao Tome and PrincipeSaudi ArabiaSenegalSerbiaSeychellesSierra LeoneSingaporeSint Maarten (Dutch part)Slovak RepublicSloveniaSmall statesSolomon IslandsSouth AfricaSouth AsiaSouth Asia (IDA & IBRD)South SudanSpainSri LankaSt. Kitts and NevisSt. LuciaSt. Vincent and the GrenadinesSub-Saharan Africa Sub-Saharan Africa (excluding high income)Sub-Saharan Africa (IDA & IBRD countries)SudanSurinameSwazilandSwedenSwitzerlandSyrian Arab RepublicTajikistanTanzaniaThailandTimor-LesteTogoTongaTrinidad and TobagoTunisiaTurkeyTuvaluUgandaUkraineUnited KingdomUnited StatesUpper middle incomeUruguayVanuatuVenezuela, RBWest Bank and GazaWorldYemen, Rep.ZambiaZimbabwe Timeline:
This timeline shows a graph from 1976 to 2016 of Euro area. No data until 1975. Number of actual observations by date: 41.
Source name:
World Development Indicators
Source organization:
International Monetary Fund, Balance of Payments Statistics Yearbook and data files.
Categories, topics:
Economy & Growth, Trade
Last updated:
apr 23, 2017
Indicators value changes by year
Minimum:
33.634
jan 1, 1993
Maximum:
50.729
jan 1, 2016
At the date of observation
Value
Absolute change
Change from previous value
jan 1, 1976
42.12
+42.12
0.0%
jan 1, 1977
41.161
-0.959
-2.28%
jan 1, 1978
39.812
-1.349
-3.28%
jan 1, 1979
40.956
+1.144
2.87%
jan 1, 1980
39.676
-1.279
-3.12%
jan 1, 1981
39.93
+0.253
0.64%
jan 1, 1982
41.577
+1.647
4.13%
jan 1, 1983
41.012
-0.565
-1.36%
jan 1, 1984
41.232
+0.22
0.54%
jan 1, 1985
39.922
-1.311
-3.18%
jan 1, 1986
40.112
+0.19
0.48%
jan 1, 1987
39.876
-0.235
-0.59%
jan 1, 1988
39.434
-0.442
-1.11%
jan 1, 1989
36.367
-3.067
-7.78%
jan 1, 1990
36.456
+0.089
0.24%
jan 1, 1991
38.065
+1.609
4.41%
jan 1, 1992
36.415
-1.649
-4.33%
jan 1, 1993
33.634
-2.782
-7.64%
jan 1, 1994
34.802
+1.169
3.47%
jan 1, 1995
36.882
+2.079
5.97%
jan 1, 1996
36.282
-0.599
-1.63%
jan 1, 1997
35.85
-0.432
-1.19%
jan 1, 1998
36.043
+0.193
0.54%
jan 1, 1999
36.738
+0.695
1.93%
jan 1, 2000
37.63
+0.893
2.43%
jan 1, 2001
38.304
+0.673
1.79%
jan 1, 2002
40.842
+2.538
6.63%
jan 1, 2003
42.371
+1.529
3.74%
jan 1, 2004
44.609
+2.239
5.28%
jan 1, 2005
43.397
-1.212
-2.72%
jan 1, 2006
45.279
+1.882
4.34%
jan 1, 2007
43.623
-1.656
-3.66%
jan 1, 2008
43.737
+0.114
0.26%
jan 1, 2009
43.833
+0.096
0.22%
jan 1, 2010
46.261
+2.428
5.54%
jan 1, 2011
46.45
+0.19
0.41%
jan 1, 2012
47.054
+0.604
1.3%
jan 1, 2013
48.994
+1.94
4.12%
jan 1, 2014
48.096
-0.898
-1.83%
jan 1, 2015
49.342
+1.246
2.59%
jan 1, 2016
50.729
+1.387
2.81%
Ranking of countries by current statistics by years


Comments: