29
/
en
AIzaSyAYiBZKx7MnpbEhh9jyipgxe19OcubqV5w
April 1, 2024
162331
Jamaica
JAM
true
2
1
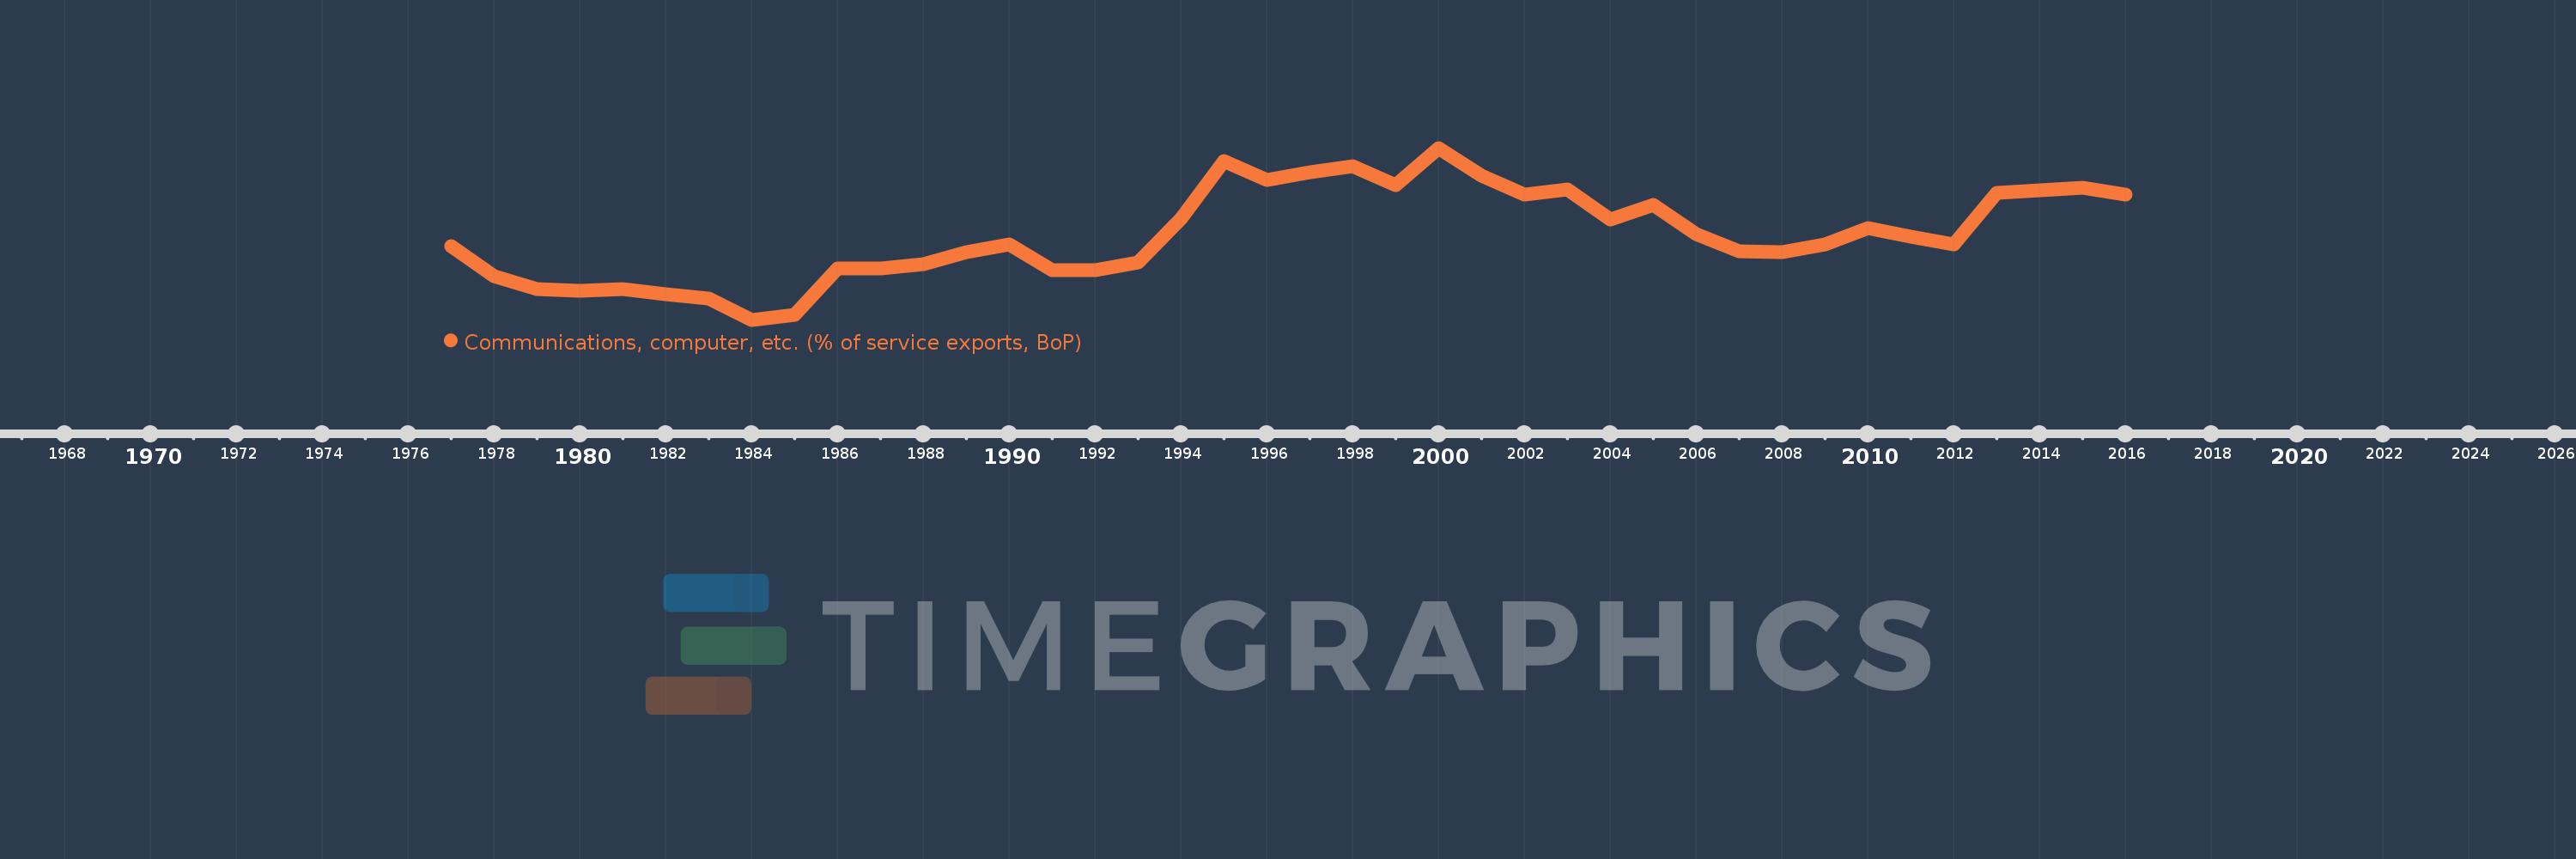
Communications, computer, etc. (% of service exports, BoP)
2016,2015,2014,2013,2012,2011,2010,2009,2008,2007,2006,2005,2004,2003,2002,2001,2000,1999,1998,1997,1996,1995,1994,1993,1992,1991,1990,1989,1988,1987,1986,1985,1984,1983,1982,1981,1980,1979,1978,1977
This statistics in other country:
AfghanistanAlbaniaAlgeriaAngolaAntigua and BarbudaArab WorldArgentinaArmeniaArubaAustraliaAustriaAzerbaijanBahamas, TheBahrainBangladeshBarbadosBelarusBelgiumBelizeBeninBermudaBhutanBoliviaBosnia and HerzegovinaBotswanaBrazilBrunei DarussalamBulgariaBurkina FasoBurundiCabo VerdeCambodiaCameroonCanadaCaribbean small statesCentral African RepublicCentral Europe and the BalticsChadChileChinaColombiaComorosCongo, Dem. Rep.Congo, Rep.Costa RicaCote d'IvoireCroatiaCuracaoCyprusCzech RepublicDenmarkDjiboutiDominicaDominican RepublicEarly-demographic dividendEast Asia & PacificEast Asia & Pacific (excluding high income)East Asia & Pacific (IDA & IBRD countries)EcuadorEgypt, Arab Rep.El SalvadorEquatorial GuineaEritreaEstoniaEthiopiaEuro areaEurope & Central AsiaEurope & Central Asia (excluding high income)Europe & Central Asia (IDA & IBRD countries)European UnionFaroe IslandsFijiFinlandFragile and conflict affected situationsFranceFrench PolynesiaGabonGambia, TheGeorgiaGermanyGhanaGreeceGrenadaGuatemalaGuineaGuinea-BissauGuyanaHaitiHeavily indebted poor countries (HIPC)High incomeHondurasHong Kong SAR, ChinaHungaryIBRD onlyIcelandIDA & IBRD totalIDA onlyIDA totalIndiaIndonesiaIran, Islamic Rep.IraqIrelandIsraelItalyJamaicaJapanJordanKazakhstanKenyaKiribatiKorea, Rep.KosovoKuwaitKyrgyz RepublicLao PDRLate-demographic dividendLatin America & Caribbean Latin America & Caribbean (excluding high income)Latin America & the Caribbean (IDA & IBRD countries)LatviaLeast developed countries: UN classificationLebanonLesothoLiberiaLibyaLithuaniaLow & middle incomeLow incomeLower middle incomeLuxembourgMacao SAR, ChinaMacedonia, FYRMadagascarMalawiMalaysiaMaldivesMaliMaltaMarshall IslandsMauritaniaMauritiusMexicoMicronesia, Fed. Sts.Middle East & North AfricaMiddle East & North Africa (excluding high income)Middle East & North Africa (IDA & IBRD countries)Middle incomeMoldovaMongoliaMontenegroMoroccoMozambiqueMyanmarNamibiaNepalNetherlandsNew CaledoniaNew ZealandNicaraguaNigerNigeriaNorth AmericaNorwayOECD membersOmanOther small statesPacific island small statesPakistanPalauPanamaPapua New GuineaParaguayPeruPhilippinesPolandPortugalPost-demographic dividendPre-demographic dividendQatarRomaniaRussian FederationRwandaSamoaSao Tome and PrincipeSaudi ArabiaSenegalSerbiaSeychellesSierra LeoneSingaporeSint Maarten (Dutch part)Slovak RepublicSloveniaSmall statesSolomon IslandsSouth AfricaSouth AsiaSouth Asia (IDA & IBRD)South SudanSpainSri LankaSt. Kitts and NevisSt. LuciaSt. Vincent and the GrenadinesSub-Saharan Africa Sub-Saharan Africa (excluding high income)Sub-Saharan Africa (IDA & IBRD countries)SudanSurinameSwazilandSwedenSwitzerlandSyrian Arab RepublicTajikistanTanzaniaThailandTimor-LesteTogoTongaTrinidad and TobagoTunisiaTurkeyTuvaluUgandaUkraineUnited KingdomUnited StatesUpper middle incomeUruguayVanuatuVenezuela, RBWest Bank and GazaWorldYemen, Rep.ZambiaZimbabwe Timeline:
This timeline shows a graph from 1977 to 2016 of Jamaica. No data until 1976. Number of actual observations by date: 40.
Source name:
World Development Indicators
Source organization:
International Monetary Fund, Balance of Payments Statistics Yearbook and data files.
Categories, topics:
Economy & Growth, Trade
Last updated:
apr 23, 2017
Indicators value changes by year
Maximum:
19.248
jan 1, 2000
At the date of observation
Value
Absolute change
Change from previous value
jan 1, 1977
10.529
+10.529
0.0%
jan 1, 1978
7.827
-2.702
-25.66%
jan 1, 1979
6.692
-1.135
-14.5%
jan 1, 1980
6.481
-0.211
-3.16%
jan 1, 1981
6.688
+0.207
3.2%
jan 1, 1982
6.22
-0.469
-7.01%
jan 1, 1983
5.822
-0.398
-6.4%
jan 1, 1984
3.925
-1.896
-32.57%
jan 1, 1985
4.397
+0.472
12.02%
jan 1, 1986
8.515
+4.118
93.66%
jan 1, 1987
8.534
+0.018
0.22%
jan 1, 1988
8.872
+0.338
3.96%
jan 1, 1989
9.958
+1.086
12.25%
jan 1, 1990
10.638
+0.68
6.83%
jan 1, 1991
8.358
-2.28
-21.43%
jan 1, 1992
8.356
-0.002
-0.03%
jan 1, 1993
9.04
+0.684
8.18%
jan 1, 1994
12.953
+3.913
43.29%
jan 1, 1995
18.112
+5.159
39.83%
jan 1, 1996
16.353
-1.76
-9.72%
jan 1, 1997
17.067
+0.715
4.37%
jan 1, 1998
17.623
+0.556
3.26%
jan 1, 1999
15.951
-1.672
-9.49%
jan 1, 2000
19.248
+3.297
20.67%
jan 1, 2001
16.774
-2.473
-12.85%
jan 1, 2002
15.108
-1.666
-9.93%
jan 1, 2003
15.537
+0.429
2.84%
jan 1, 2004
12.828
-2.708
-17.43%
jan 1, 2005
14.146
+1.318
10.28%
jan 1, 2006
11.543
-2.603
-18.4%
jan 1, 2007
10.021
-1.522
-13.18%
jan 1, 2008
9.981
-0.04
-0.4%
jan 1, 2009
10.637
+0.656
6.57%
jan 1, 2010
12.07
+1.433
13.47%
jan 1, 2011
11.308
-0.762
-6.31%
jan 1, 2012
10.638
-0.67
-5.93%
jan 1, 2013
15.267
+4.629
43.51%
jan 1, 2014
15.478
+0.211
1.38%
jan 1, 2015
15.718
+0.239
1.55%
jan 1, 2016
15.1
-0.617
-3.93%
Ranking of countries by current statistics by years


Comments: