29
/
en
AIzaSyAYiBZKx7MnpbEhh9jyipgxe19OcubqV5w
April 1, 2024
144133
Guatemala
GTM
true
2
1
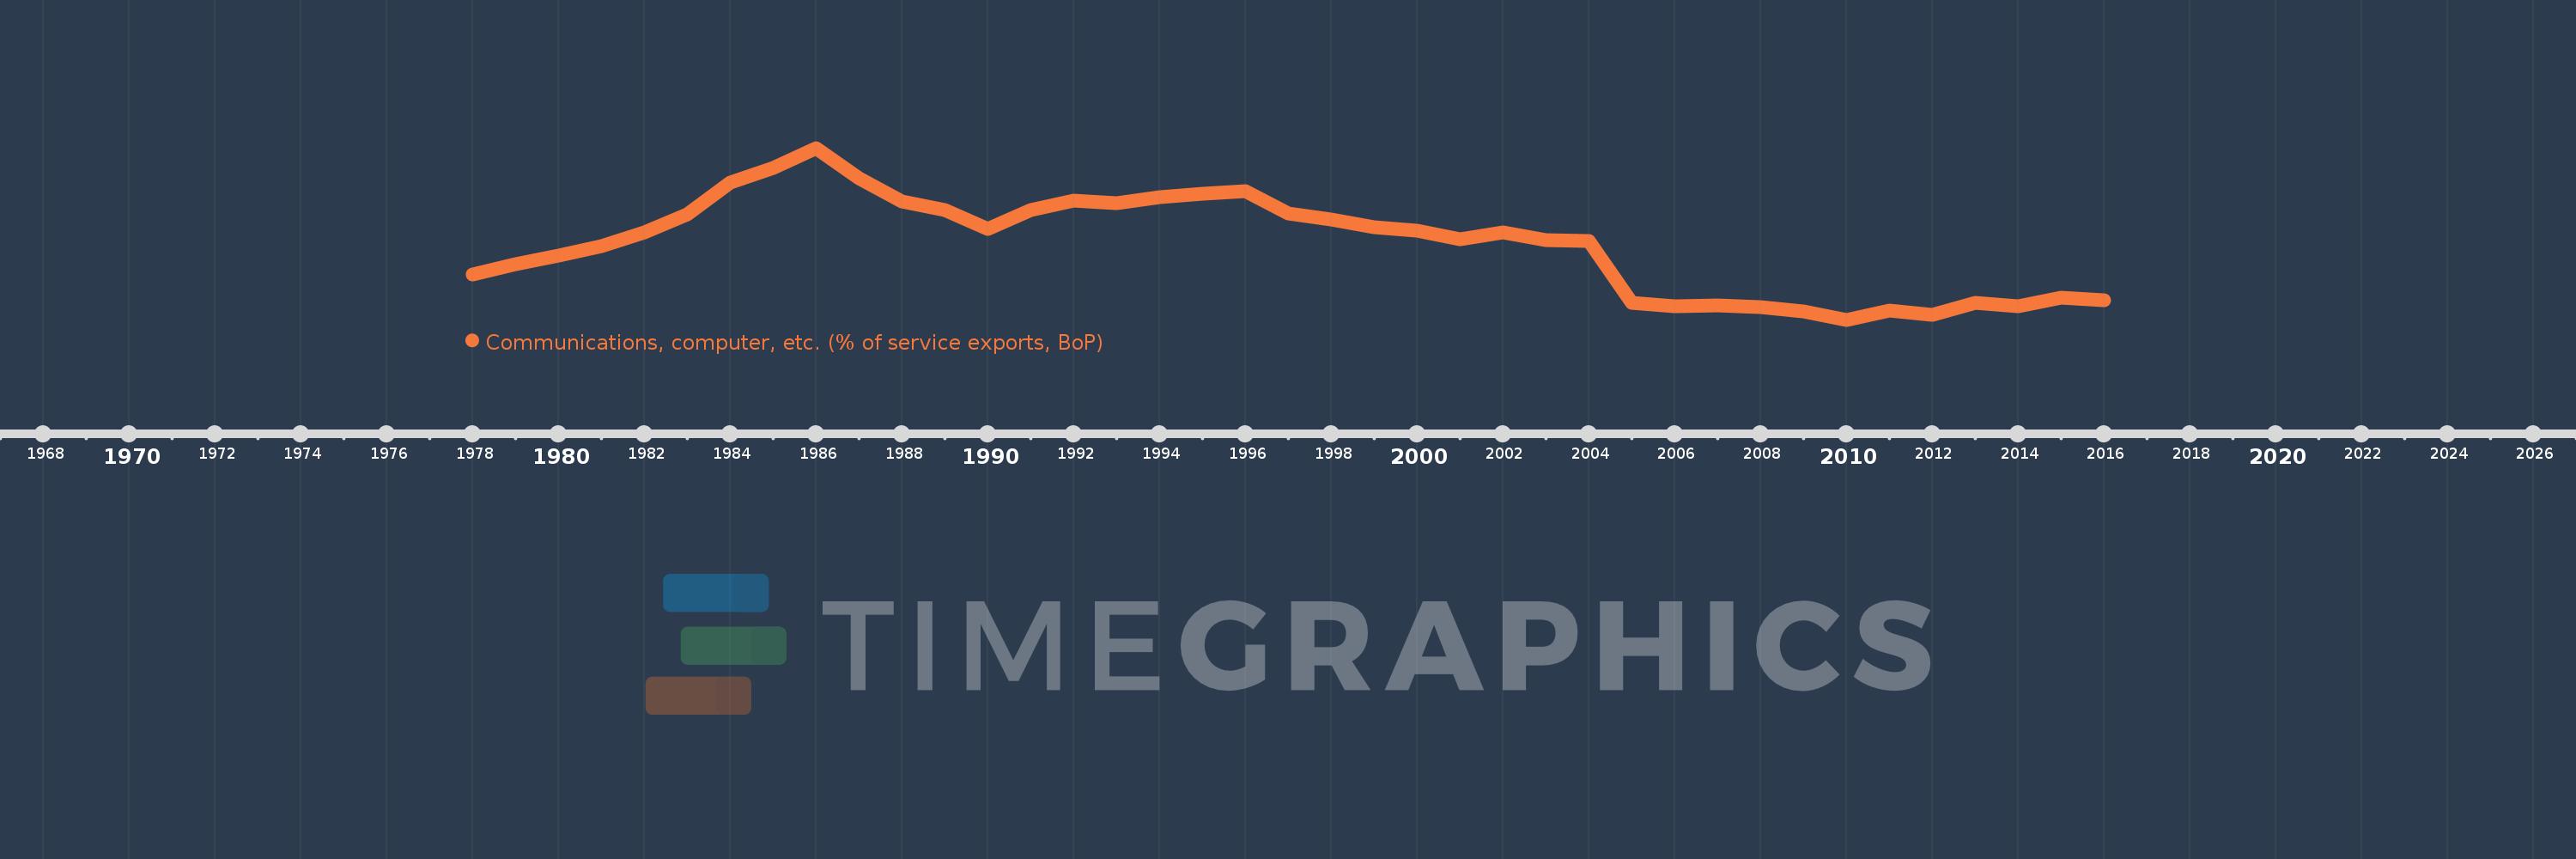
Communications, computer, etc. (% of service exports, BoP)
2016,2015,2014,2013,2012,2011,2010,2009,2008,2007,2006,2005,2004,2003,2002,2001,2000,1999,1998,1997,1996,1995,1994,1993,1992,1991,1990,1989,1988,1987,1986,1985,1984,1983,1982,1981,1980,1979,1978
This statistics in other country:
AfghanistanAlbaniaAlgeriaAngolaAntigua and BarbudaArab WorldArgentinaArmeniaArubaAustraliaAustriaAzerbaijanBahamas, TheBahrainBangladeshBarbadosBelarusBelgiumBelizeBeninBermudaBhutanBoliviaBosnia and HerzegovinaBotswanaBrazilBrunei DarussalamBulgariaBurkina FasoBurundiCabo VerdeCambodiaCameroonCanadaCaribbean small statesCentral African RepublicCentral Europe and the BalticsChadChileChinaColombiaComorosCongo, Dem. Rep.Congo, Rep.Costa RicaCote d'IvoireCroatiaCuracaoCyprusCzech RepublicDenmarkDjiboutiDominicaDominican RepublicEarly-demographic dividendEast Asia & PacificEast Asia & Pacific (excluding high income)East Asia & Pacific (IDA & IBRD countries)EcuadorEgypt, Arab Rep.El SalvadorEquatorial GuineaEritreaEstoniaEthiopiaEuro areaEurope & Central AsiaEurope & Central Asia (excluding high income)Europe & Central Asia (IDA & IBRD countries)European UnionFaroe IslandsFijiFinlandFragile and conflict affected situationsFranceFrench PolynesiaGabonGambia, TheGeorgiaGermanyGhanaGreeceGrenadaGuatemalaGuineaGuinea-BissauGuyanaHaitiHeavily indebted poor countries (HIPC)High incomeHondurasHong Kong SAR, ChinaHungaryIBRD onlyIcelandIDA & IBRD totalIDA onlyIDA totalIndiaIndonesiaIran, Islamic Rep.IraqIrelandIsraelItalyJamaicaJapanJordanKazakhstanKenyaKiribatiKorea, Rep.KosovoKuwaitKyrgyz RepublicLao PDRLate-demographic dividendLatin America & Caribbean Latin America & Caribbean (excluding high income)Latin America & the Caribbean (IDA & IBRD countries)LatviaLeast developed countries: UN classificationLebanonLesothoLiberiaLibyaLithuaniaLow & middle incomeLow incomeLower middle incomeLuxembourgMacao SAR, ChinaMacedonia, FYRMadagascarMalawiMalaysiaMaldivesMaliMaltaMarshall IslandsMauritaniaMauritiusMexicoMicronesia, Fed. Sts.Middle East & North AfricaMiddle East & North Africa (excluding high income)Middle East & North Africa (IDA & IBRD countries)Middle incomeMoldovaMongoliaMontenegroMoroccoMozambiqueMyanmarNamibiaNepalNetherlandsNew CaledoniaNew ZealandNicaraguaNigerNigeriaNorth AmericaNorwayOECD membersOmanOther small statesPacific island small statesPakistanPalauPanamaPapua New GuineaParaguayPeruPhilippinesPolandPortugalPost-demographic dividendPre-demographic dividendQatarRomaniaRussian FederationRwandaSamoaSao Tome and PrincipeSaudi ArabiaSenegalSerbiaSeychellesSierra LeoneSingaporeSint Maarten (Dutch part)Slovak RepublicSloveniaSmall statesSolomon IslandsSouth AfricaSouth AsiaSouth Asia (IDA & IBRD)South SudanSpainSri LankaSt. Kitts and NevisSt. LuciaSt. Vincent and the GrenadinesSub-Saharan Africa Sub-Saharan Africa (excluding high income)Sub-Saharan Africa (IDA & IBRD countries)SudanSurinameSwazilandSwedenSwitzerlandSyrian Arab RepublicTajikistanTanzaniaThailandTimor-LesteTogoTongaTrinidad and TobagoTunisiaTurkeyTuvaluUgandaUkraineUnited KingdomUnited StatesUpper middle incomeUruguayVanuatuVenezuela, RBWest Bank and GazaWorldYemen, Rep.ZambiaZimbabwe Timeline:
This timeline shows a graph from 1978 to 2016 of Guatemala. No data until 1977. Number of actual observations by date: 39.
Source name:
World Development Indicators
Source organization:
International Monetary Fund, Balance of Payments Statistics Yearbook and data files.
Categories, topics:
Economy & Growth, Trade
Last updated:
apr 23, 2017
Indicators value changes by year
Minimum:
21.591
jan 1, 2010
Maximum:
79.723
jan 1, 1986
At the date of observation
Value
Absolute change
Change from previous value
jan 1, 1978
36.78
+36.78
0.0%
jan 1, 1979
40.533
+3.753
10.2%
jan 1, 1980
43.282
+2.749
6.78%
jan 1, 1981
46.544
+3.261
7.53%
jan 1, 1982
51.193
+4.649
9.99%
jan 1, 1983
57.342
+6.149
12.01%
jan 1, 1984
67.87
+10.528
18.36%
jan 1, 1985
72.813
+4.942
7.28%
jan 1, 1986
79.723
+6.911
9.49%
jan 1, 1987
69.442
-10.281
-12.9%
jan 1, 1988
61.655
-7.787
-11.21%
jan 1, 1989
58.784
-2.871
-4.66%
jan 1, 1990
52.402
-6.383
-10.86%
jan 1, 1991
58.691
+6.29
12.0%
jan 1, 1992
61.879
+3.187
5.43%
jan 1, 1993
61.059
-0.82
-1.33%
jan 1, 1994
63.128
+2.07
3.39%
jan 1, 1995
64.143
+1.015
1.61%
jan 1, 1996
64.993
+0.849
1.32%
jan 1, 1997
57.44
-7.553
-11.62%
jan 1, 1998
55.618
-1.822
-3.17%
jan 1, 1999
53.022
-2.596
-4.67%
jan 1, 2000
51.864
-1.158
-2.18%
jan 1, 2001
48.724
-3.14
-6.05%
jan 1, 2002
51.292
+2.568
5.27%
jan 1, 2003
48.611
-2.681
-5.23%
jan 1, 2004
48.287
-0.324
-0.67%
jan 1, 2005
27.272
-21.015
-43.52%
jan 1, 2006
26.265
-1.006
-3.69%
jan 1, 2007
26.486
+0.221
0.84%
jan 1, 2008
25.976
-0.51
-1.93%
jan 1, 2009
24.423
-1.553
-5.98%
jan 1, 2010
21.591
-2.831
-11.59%
jan 1, 2011
24.664
+3.072
14.23%
jan 1, 2012
23.198
-1.465
-5.94%
jan 1, 2013
27.329
+4.131
17.81%
jan 1, 2014
26.26
-1.069
-3.91%
jan 1, 2015
28.939
+2.678
10.2%
jan 1, 2016
28.131
-0.808
-2.79%
Ranking of countries by current statistics by years


Comments: