29
/
en
AIzaSyAYiBZKx7MnpbEhh9jyipgxe19OcubqV5w
April 1, 2024
116709
Cyprus
CYP
true
2
1
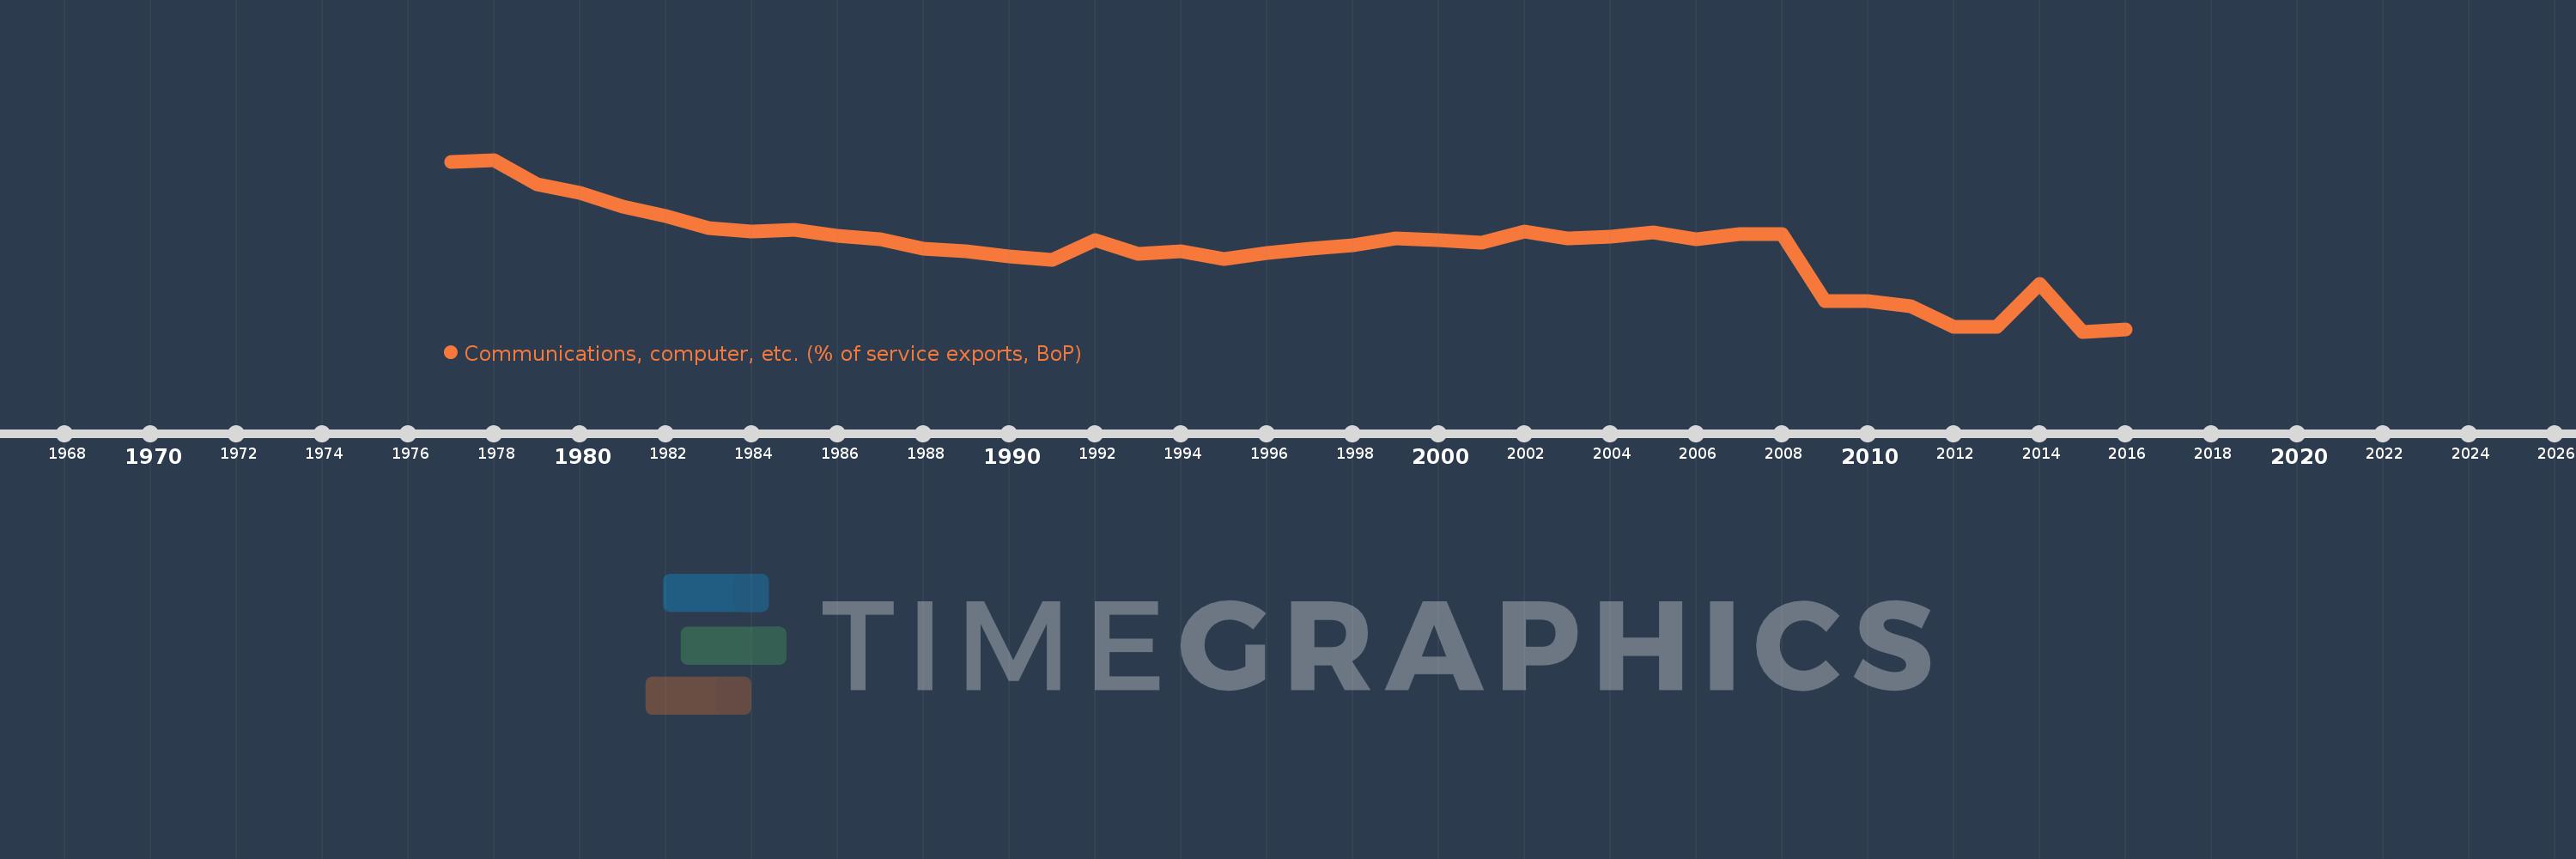
Communications, computer, etc. (% of service exports, BoP)
2016,2015,2014,2013,2012,2011,2010,2009,2008,2007,2006,2005,2004,2003,2002,2001,2000,1999,1998,1997,1996,1995,1994,1993,1992,1991,1990,1989,1988,1987,1986,1985,1984,1983,1982,1981,1980,1979,1978,1977
This statistics in other country:
AfghanistanAlbaniaAlgeriaAngolaAntigua and BarbudaArab WorldArgentinaArmeniaArubaAustraliaAustriaAzerbaijanBahamas, TheBahrainBangladeshBarbadosBelarusBelgiumBelizeBeninBermudaBhutanBoliviaBosnia and HerzegovinaBotswanaBrazilBrunei DarussalamBulgariaBurkina FasoBurundiCabo VerdeCambodiaCameroonCanadaCaribbean small statesCentral African RepublicCentral Europe and the BalticsChadChileChinaColombiaComorosCongo, Dem. Rep.Congo, Rep.Costa RicaCote d'IvoireCroatiaCuracaoCyprusCzech RepublicDenmarkDjiboutiDominicaDominican RepublicEarly-demographic dividendEast Asia & PacificEast Asia & Pacific (excluding high income)East Asia & Pacific (IDA & IBRD countries)EcuadorEgypt, Arab Rep.El SalvadorEquatorial GuineaEritreaEstoniaEthiopiaEuro areaEurope & Central AsiaEurope & Central Asia (excluding high income)Europe & Central Asia (IDA & IBRD countries)European UnionFaroe IslandsFijiFinlandFragile and conflict affected situationsFranceFrench PolynesiaGabonGambia, TheGeorgiaGermanyGhanaGreeceGrenadaGuatemalaGuineaGuinea-BissauGuyanaHaitiHeavily indebted poor countries (HIPC)High incomeHondurasHong Kong SAR, ChinaHungaryIBRD onlyIcelandIDA & IBRD totalIDA onlyIDA totalIndiaIndonesiaIran, Islamic Rep.IraqIrelandIsraelItalyJamaicaJapanJordanKazakhstanKenyaKiribatiKorea, Rep.KosovoKuwaitKyrgyz RepublicLao PDRLate-demographic dividendLatin America & Caribbean Latin America & Caribbean (excluding high income)Latin America & the Caribbean (IDA & IBRD countries)LatviaLeast developed countries: UN classificationLebanonLesothoLiberiaLibyaLithuaniaLow & middle incomeLow incomeLower middle incomeLuxembourgMacao SAR, ChinaMacedonia, FYRMadagascarMalawiMalaysiaMaldivesMaliMaltaMarshall IslandsMauritaniaMauritiusMexicoMicronesia, Fed. Sts.Middle East & North AfricaMiddle East & North Africa (excluding high income)Middle East & North Africa (IDA & IBRD countries)Middle incomeMoldovaMongoliaMontenegroMoroccoMozambiqueMyanmarNamibiaNepalNetherlandsNew CaledoniaNew ZealandNicaraguaNigerNigeriaNorth AmericaNorwayOECD membersOmanOther small statesPacific island small statesPakistanPalauPanamaPapua New GuineaParaguayPeruPhilippinesPolandPortugalPost-demographic dividendPre-demographic dividendQatarRomaniaRussian FederationRwandaSamoaSao Tome and PrincipeSaudi ArabiaSenegalSerbiaSeychellesSierra LeoneSingaporeSint Maarten (Dutch part)Slovak RepublicSloveniaSmall statesSolomon IslandsSouth AfricaSouth AsiaSouth Asia (IDA & IBRD)South SudanSpainSri LankaSt. Kitts and NevisSt. LuciaSt. Vincent and the GrenadinesSub-Saharan Africa Sub-Saharan Africa (excluding high income)Sub-Saharan Africa (IDA & IBRD countries)SudanSurinameSwazilandSwedenSwitzerlandSyrian Arab RepublicTajikistanTanzaniaThailandTimor-LesteTogoTongaTrinidad and TobagoTunisiaTurkeyTuvaluUgandaUkraineUnited KingdomUnited StatesUpper middle incomeUruguayVanuatuVenezuela, RBWest Bank and GazaWorldYemen, Rep.ZambiaZimbabwe Timeline:
This timeline shows a graph from 1977 to 2016 of Cyprus. No data until 1976. Number of actual observations by date: 40.
Source name:
World Development Indicators
Source organization:
International Monetary Fund, Balance of Payments Statistics Yearbook and data files.
Categories, topics:
Economy & Growth, Trade
Last updated:
apr 23, 2017
Indicators value changes by year
Maximum:
53.499
jan 1, 1978
At the date of observation
Value
Absolute change
Change from previous value
jan 1, 1977
52.909
+52.909
0.0%
jan 1, 1978
53.499
+0.591
1.12%
jan 1, 1979
46.377
-7.123
-13.31%
jan 1, 1980
43.845
-2.532
-5.46%
jan 1, 1981
39.8
-4.045
-9.23%
jan 1, 1982
37.134
-2.666
-6.7%
jan 1, 1983
33.601
-3.533
-9.51%
jan 1, 1984
32.627
-0.973
-2.9%
jan 1, 1985
32.994
+0.367
1.13%
jan 1, 1986
31.417
-1.577
-4.78%
jan 1, 1987
30.249
-1.168
-3.72%
jan 1, 1988
27.489
-2.76
-9.12%
jan 1, 1989
26.719
-0.77
-2.8%
jan 1, 1990
25.319
-1.401
-5.24%
jan 1, 1991
24.406
-0.912
-3.6%
jan 1, 1992
30.11
+5.704
23.37%
jan 1, 1993
26.043
-4.067
-13.51%
jan 1, 1994
26.957
+0.913
3.51%
jan 1, 1995
24.649
-2.308
-8.56%
jan 1, 1996
26.288
+1.639
6.65%
jan 1, 1997
27.692
+1.405
5.34%
jan 1, 1998
28.472
+0.78
2.82%
jan 1, 1999
30.713
+2.24
7.87%
jan 1, 2000
29.977
-0.736
-2.4%
jan 1, 2001
29.455
-0.522
-1.74%
jan 1, 2002
32.529
+3.074
10.44%
jan 1, 2003
30.551
-1.978
-6.08%
jan 1, 2004
31.124
+0.573
1.88%
jan 1, 2005
32.384
+1.26
4.05%
jan 1, 2006
30.248
-2.136
-6.6%
jan 1, 2007
31.97
+1.722
5.69%
jan 1, 2008
31.765
-0.205
-0.64%
jan 1, 2009
12.369
-19.396
-61.06%
jan 1, 2010
12.256
-0.114
-0.92%
jan 1, 2011
10.846
-1.409
-11.5%
jan 1, 2012
4.776
-6.071
-55.97%
jan 1, 2013
4.756
-0.02
-0.41%
jan 1, 2014
17.279
+12.523
263.3%
jan 1, 2015
3.434
-13.845
-80.13%
jan 1, 2016
4.103
+0.669
19.49%
Ranking of countries by current statistics by years


Comments: