29
/
en
AIzaSyAYiBZKx7MnpbEhh9jyipgxe19OcubqV5w
April 1, 2024
152335
Hungary
HUN
true
2
1
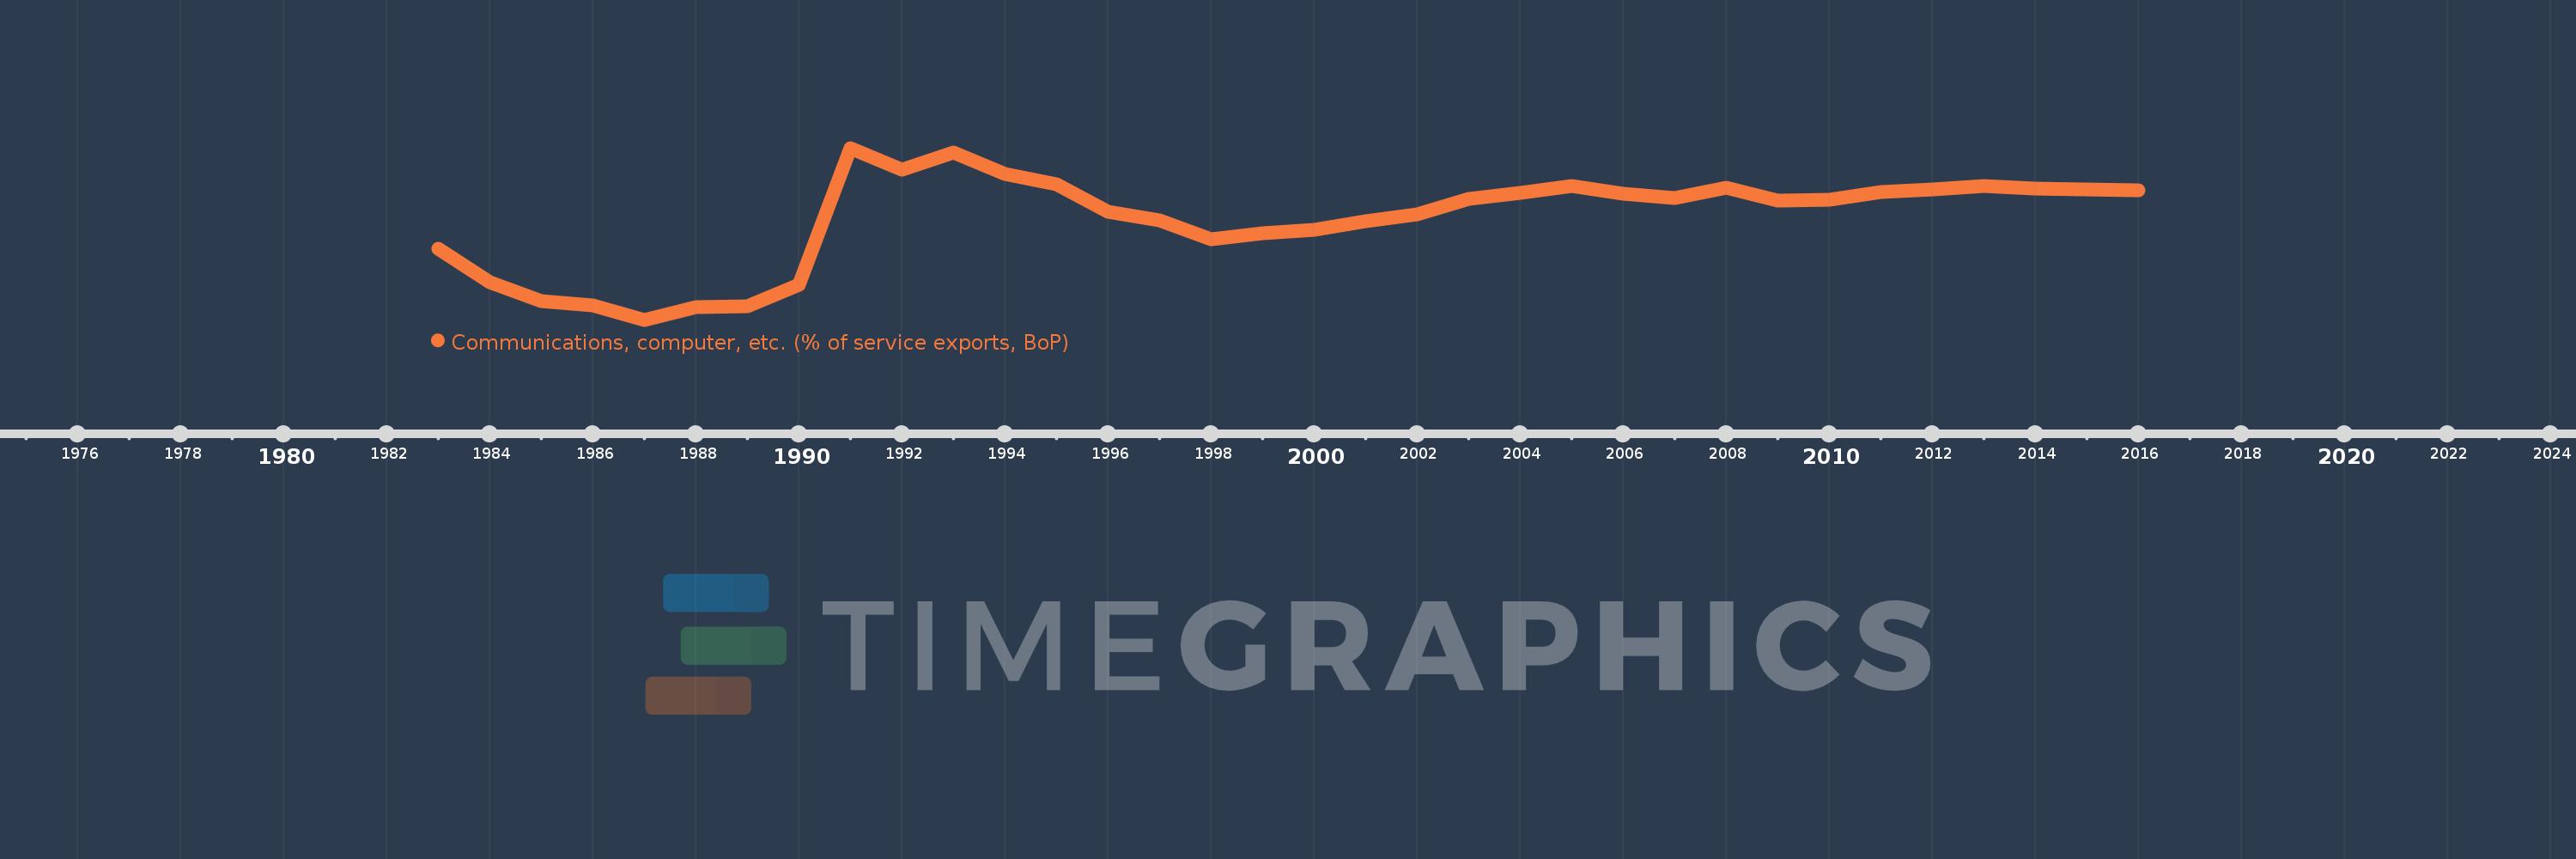
Communications, computer, etc. (% of service exports, BoP)
2016,2015,2014,2013,2012,2011,2010,2009,2008,2007,2006,2005,2004,2003,2002,2001,2000,1999,1998,1997,1996,1995,1994,1993,1992,1991,1990,1989,1988,1987,1986,1985,1984,1983
This statistics in other country:
AfghanistanAlbaniaAlgeriaAngolaAntigua and BarbudaArab WorldArgentinaArmeniaArubaAustraliaAustriaAzerbaijanBahamas, TheBahrainBangladeshBarbadosBelarusBelgiumBelizeBeninBermudaBhutanBoliviaBosnia and HerzegovinaBotswanaBrazilBrunei DarussalamBulgariaBurkina FasoBurundiCabo VerdeCambodiaCameroonCanadaCaribbean small statesCentral African RepublicCentral Europe and the BalticsChadChileChinaColombiaComorosCongo, Dem. Rep.Congo, Rep.Costa RicaCote d'IvoireCroatiaCuracaoCyprusCzech RepublicDenmarkDjiboutiDominicaDominican RepublicEarly-demographic dividendEast Asia & PacificEast Asia & Pacific (excluding high income)East Asia & Pacific (IDA & IBRD countries)EcuadorEgypt, Arab Rep.El SalvadorEquatorial GuineaEritreaEstoniaEthiopiaEuro areaEurope & Central AsiaEurope & Central Asia (excluding high income)Europe & Central Asia (IDA & IBRD countries)European UnionFaroe IslandsFijiFinlandFragile and conflict affected situationsFranceFrench PolynesiaGabonGambia, TheGeorgiaGermanyGhanaGreeceGrenadaGuatemalaGuineaGuinea-BissauGuyanaHaitiHeavily indebted poor countries (HIPC)High incomeHondurasHong Kong SAR, ChinaHungaryIBRD onlyIcelandIDA & IBRD totalIDA onlyIDA totalIndiaIndonesiaIran, Islamic Rep.IraqIrelandIsraelItalyJamaicaJapanJordanKazakhstanKenyaKiribatiKorea, Rep.KosovoKuwaitKyrgyz RepublicLao PDRLate-demographic dividendLatin America & Caribbean Latin America & Caribbean (excluding high income)Latin America & the Caribbean (IDA & IBRD countries)LatviaLeast developed countries: UN classificationLebanonLesothoLiberiaLibyaLithuaniaLow & middle incomeLow incomeLower middle incomeLuxembourgMacao SAR, ChinaMacedonia, FYRMadagascarMalawiMalaysiaMaldivesMaliMaltaMarshall IslandsMauritaniaMauritiusMexicoMicronesia, Fed. Sts.Middle East & North AfricaMiddle East & North Africa (excluding high income)Middle East & North Africa (IDA & IBRD countries)Middle incomeMoldovaMongoliaMontenegroMoroccoMozambiqueMyanmarNamibiaNepalNetherlandsNew CaledoniaNew ZealandNicaraguaNigerNigeriaNorth AmericaNorwayOECD membersOmanOther small statesPacific island small statesPakistanPalauPanamaPapua New GuineaParaguayPeruPhilippinesPolandPortugalPost-demographic dividendPre-demographic dividendQatarRomaniaRussian FederationRwandaSamoaSao Tome and PrincipeSaudi ArabiaSenegalSerbiaSeychellesSierra LeoneSingaporeSint Maarten (Dutch part)Slovak RepublicSloveniaSmall statesSolomon IslandsSouth AfricaSouth AsiaSouth Asia (IDA & IBRD)South SudanSpainSri LankaSt. Kitts and NevisSt. LuciaSt. Vincent and the GrenadinesSub-Saharan Africa Sub-Saharan Africa (excluding high income)Sub-Saharan Africa (IDA & IBRD countries)SudanSurinameSwazilandSwedenSwitzerlandSyrian Arab RepublicTajikistanTanzaniaThailandTimor-LesteTogoTongaTrinidad and TobagoTunisiaTurkeyTuvaluUgandaUkraineUnited KingdomUnited StatesUpper middle incomeUruguayVanuatuVenezuela, RBWest Bank and GazaWorldYemen, Rep.ZambiaZimbabwe Timeline:
This timeline shows a graph from 1983 to 2016 of Hungary. No data until 1982. Number of actual observations by date: 34.
Source name:
World Development Indicators
Source organization:
International Monetary Fund, Balance of Payments Statistics Yearbook and data files.
Categories, topics:
Economy & Growth, Trade
Last updated:
apr 23, 2017
Indicators value changes by year
Maximum:
64.208
jan 1, 1991
At the date of observation
Value
Absolute change
Change from previous value
jan 1, 1983
30.49
+30.49
0.0%
jan 1, 1984
19.353
-11.137
-36.53%
jan 1, 1985
12.941
-6.412
-33.13%
jan 1, 1986
11.577
-1.364
-10.54%
jan 1, 1987
6.719
-4.857
-41.96%
jan 1, 1988
11.021
+4.301
64.01%
jan 1, 1989
11.176
+0.155
1.41%
jan 1, 1990
18.437
+7.261
64.97%
jan 1, 1991
64.208
+45.772
248.26%
jan 1, 1992
56.847
-7.361
-11.46%
jan 1, 1993
62.756
+5.909
10.4%
jan 1, 1994
55.528
-7.228
-11.52%
jan 1, 1995
52.144
-3.384
-6.09%
jan 1, 1996
42.867
-9.277
-17.79%
jan 1, 1997
39.996
-2.87
-6.7%
jan 1, 1998
33.697
-6.299
-15.75%
jan 1, 1999
35.538
+1.841
5.46%
jan 1, 2000
36.862
+1.324
3.73%
jan 1, 2001
39.78
+2.918
7.92%
jan 1, 2002
41.854
+2.074
5.21%
jan 1, 2003
47.281
+5.427
12.97%
jan 1, 2004
49.308
+2.027
4.29%
jan 1, 2005
51.603
+2.295
4.65%
jan 1, 2006
48.966
-2.637
-5.11%
jan 1, 2007
47.453
-1.513
-3.09%
jan 1, 2008
50.89
+3.436
7.24%
jan 1, 2009
46.553
-4.337
-8.52%
jan 1, 2010
46.905
+0.352
0.76%
jan 1, 2011
49.441
+2.536
5.41%
jan 1, 2012
50.388
+0.947
1.92%
jan 1, 2013
51.606
+1.218
2.42%
jan 1, 2014
50.644
-0.962
-1.86%
jan 1, 2015
50.395
-0.249
-0.49%
jan 1, 2016
49.973
-0.422
-0.84%
Ranking of countries by current statistics by years


Comments: