29
/
en
AIzaSyAYiBZKx7MnpbEhh9jyipgxe19OcubqV5w
April 1, 2024
124592
Egypt, Arab Rep.
EGY
true
2
1
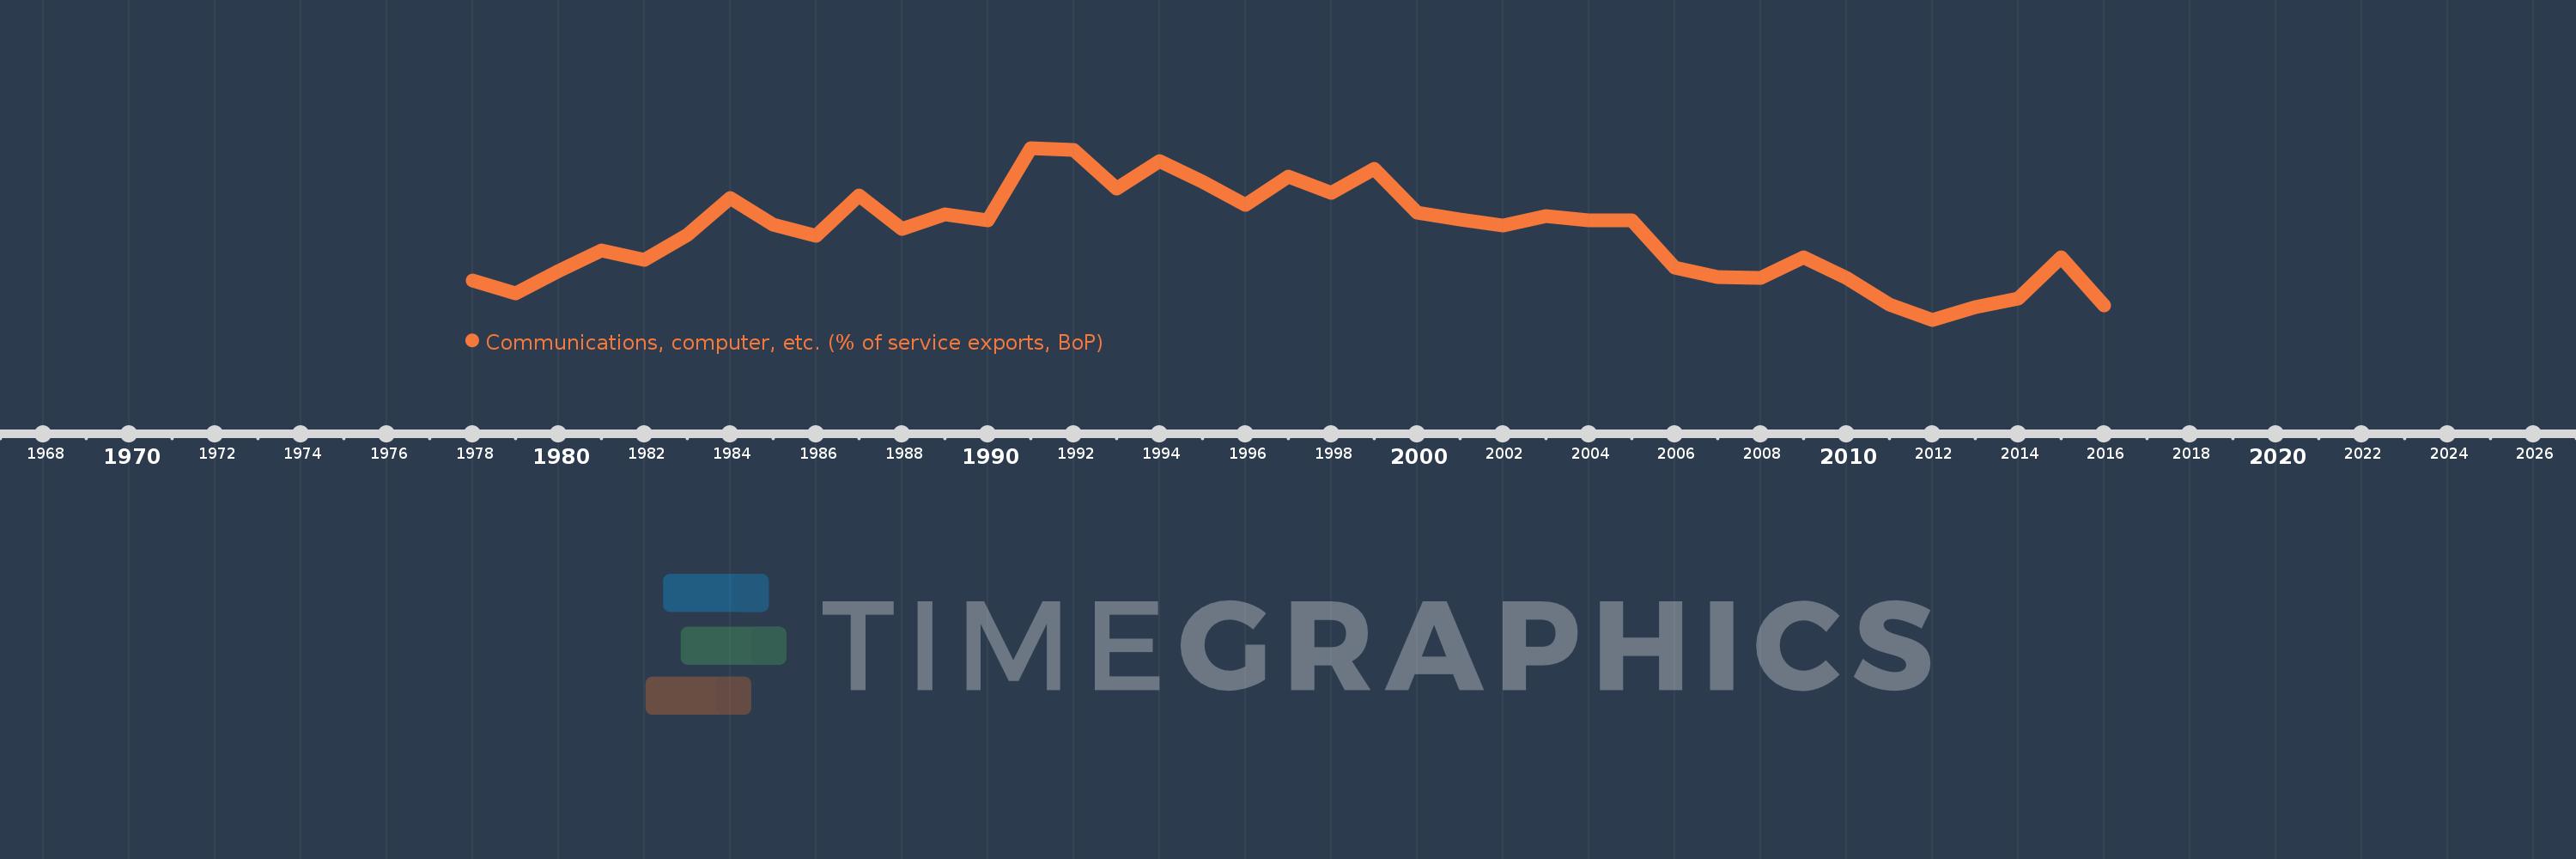
Communications, computer, etc. (% of service exports, BoP)
2016,2015,2014,2013,2012,2011,2010,2009,2008,2007,2006,2005,2004,2003,2002,2001,2000,1999,1998,1997,1996,1995,1994,1993,1992,1991,1990,1989,1988,1987,1986,1985,1984,1983,1982,1981,1980,1979,1978
This statistics in other country:
AfghanistanAlbaniaAlgeriaAngolaAntigua and BarbudaArab WorldArgentinaArmeniaArubaAustraliaAustriaAzerbaijanBahamas, TheBahrainBangladeshBarbadosBelarusBelgiumBelizeBeninBermudaBhutanBoliviaBosnia and HerzegovinaBotswanaBrazilBrunei DarussalamBulgariaBurkina FasoBurundiCabo VerdeCambodiaCameroonCanadaCaribbean small statesCentral African RepublicCentral Europe and the BalticsChadChileChinaColombiaComorosCongo, Dem. Rep.Congo, Rep.Costa RicaCote d'IvoireCroatiaCuracaoCyprusCzech RepublicDenmarkDjiboutiDominicaDominican RepublicEarly-demographic dividendEast Asia & PacificEast Asia & Pacific (excluding high income)East Asia & Pacific (IDA & IBRD countries)EcuadorEgypt, Arab Rep.El SalvadorEquatorial GuineaEritreaEstoniaEthiopiaEuro areaEurope & Central AsiaEurope & Central Asia (excluding high income)Europe & Central Asia (IDA & IBRD countries)European UnionFaroe IslandsFijiFinlandFragile and conflict affected situationsFranceFrench PolynesiaGabonGambia, TheGeorgiaGermanyGhanaGreeceGrenadaGuatemalaGuineaGuinea-BissauGuyanaHaitiHeavily indebted poor countries (HIPC)High incomeHondurasHong Kong SAR, ChinaHungaryIBRD onlyIcelandIDA & IBRD totalIDA onlyIDA totalIndiaIndonesiaIran, Islamic Rep.IraqIrelandIsraelItalyJamaicaJapanJordanKazakhstanKenyaKiribatiKorea, Rep.KosovoKuwaitKyrgyz RepublicLao PDRLate-demographic dividendLatin America & Caribbean Latin America & Caribbean (excluding high income)Latin America & the Caribbean (IDA & IBRD countries)LatviaLeast developed countries: UN classificationLebanonLesothoLiberiaLibyaLithuaniaLow & middle incomeLow incomeLower middle incomeLuxembourgMacao SAR, ChinaMacedonia, FYRMadagascarMalawiMalaysiaMaldivesMaliMaltaMarshall IslandsMauritaniaMauritiusMexicoMicronesia, Fed. Sts.Middle East & North AfricaMiddle East & North Africa (excluding high income)Middle East & North Africa (IDA & IBRD countries)Middle incomeMoldovaMongoliaMontenegroMoroccoMozambiqueMyanmarNamibiaNepalNetherlandsNew CaledoniaNew ZealandNicaraguaNigerNigeriaNorth AmericaNorwayOECD membersOmanOther small statesPacific island small statesPakistanPalauPanamaPapua New GuineaParaguayPeruPhilippinesPolandPortugalPost-demographic dividendPre-demographic dividendQatarRomaniaRussian FederationRwandaSamoaSao Tome and PrincipeSaudi ArabiaSenegalSerbiaSeychellesSierra LeoneSingaporeSint Maarten (Dutch part)Slovak RepublicSloveniaSmall statesSolomon IslandsSouth AfricaSouth AsiaSouth Asia (IDA & IBRD)South SudanSpainSri LankaSt. Kitts and NevisSt. LuciaSt. Vincent and the GrenadinesSub-Saharan Africa Sub-Saharan Africa (excluding high income)Sub-Saharan Africa (IDA & IBRD countries)SudanSurinameSwazilandSwedenSwitzerlandSyrian Arab RepublicTajikistanTanzaniaThailandTimor-LesteTogoTongaTrinidad and TobagoTunisiaTurkeyTuvaluUgandaUkraineUnited KingdomUnited StatesUpper middle incomeUruguayVanuatuVenezuela, RBWest Bank and GazaWorldYemen, Rep.ZambiaZimbabwe Timeline:
This timeline shows a graph from 1978 to 2016 of Egypt, Arab Rep.. No data until 1977. Number of actual observations by date: 39.
Source name:
World Development Indicators
Source organization:
International Monetary Fund, Balance of Payments Statistics Yearbook and data files.
Categories, topics:
Economy & Growth, Trade
Last updated:
apr 23, 2017
Indicators value changes by year
Maximum:
40.454
jan 1, 1991
At the date of observation
Value
Absolute change
Change from previous value
jan 1, 1978
17.082
+17.082
0.0%
jan 1, 1979
14.927
-2.154
-12.61%
jan 1, 1980
18.809
+3.882
26.01%
jan 1, 1981
22.401
+3.592
19.1%
jan 1, 1982
20.829
-1.572
-7.02%
jan 1, 1983
25.111
+4.282
20.56%
jan 1, 1984
31.658
+6.547
26.07%
jan 1, 1985
27.021
-4.637
-14.65%
jan 1, 1986
24.928
-2.093
-7.75%
jan 1, 1987
32.149
+7.221
28.97%
jan 1, 1988
26.237
-5.912
-18.39%
jan 1, 1989
28.788
+2.551
9.72%
jan 1, 1990
27.756
-1.032
-3.59%
jan 1, 1991
40.454
+12.698
45.75%
jan 1, 1992
40.1
-0.354
-0.87%
jan 1, 1993
33.269
-6.832
-17.04%
jan 1, 1994
38.189
+4.92
14.79%
jan 1, 1995
34.461
-3.728
-9.76%
jan 1, 1996
30.512
-3.949
-11.46%
jan 1, 1997
35.433
+4.921
16.13%
jan 1, 1998
32.489
-2.944
-8.31%
jan 1, 1999
36.715
+4.227
13.01%
jan 1, 2000
29.082
-7.633
-20.79%
jan 1, 2001
27.859
-1.224
-4.21%
jan 1, 2002
26.812
-1.047
-3.76%
jan 1, 2003
28.46
+1.648
6.15%
jan 1, 2004
27.762
-0.698
-2.45%
jan 1, 2005
27.778
+0.016
0.06%
jan 1, 2006
19.472
-8.306
-29.9%
jan 1, 2007
17.784
-1.688
-8.67%
jan 1, 2008
17.668
-0.116
-0.65%
jan 1, 2009
21.202
+3.534
20.0%
jan 1, 2010
17.636
-3.565
-16.82%
jan 1, 2011
12.963
-4.673
-26.5%
jan 1, 2012
10.24
-2.723
-21.01%
jan 1, 2013
12.489
+2.249
21.97%
jan 1, 2014
13.958
+1.469
11.76%
jan 1, 2015
21.228
+7.27
52.09%
jan 1, 2016
12.699
-8.529
-40.18%
Ranking of countries by current statistics by years


Comments: