29
/
en
AIzaSyAYiBZKx7MnpbEhh9jyipgxe19OcubqV5w
April 1, 2024
51732
North America
NAC
false
2
1
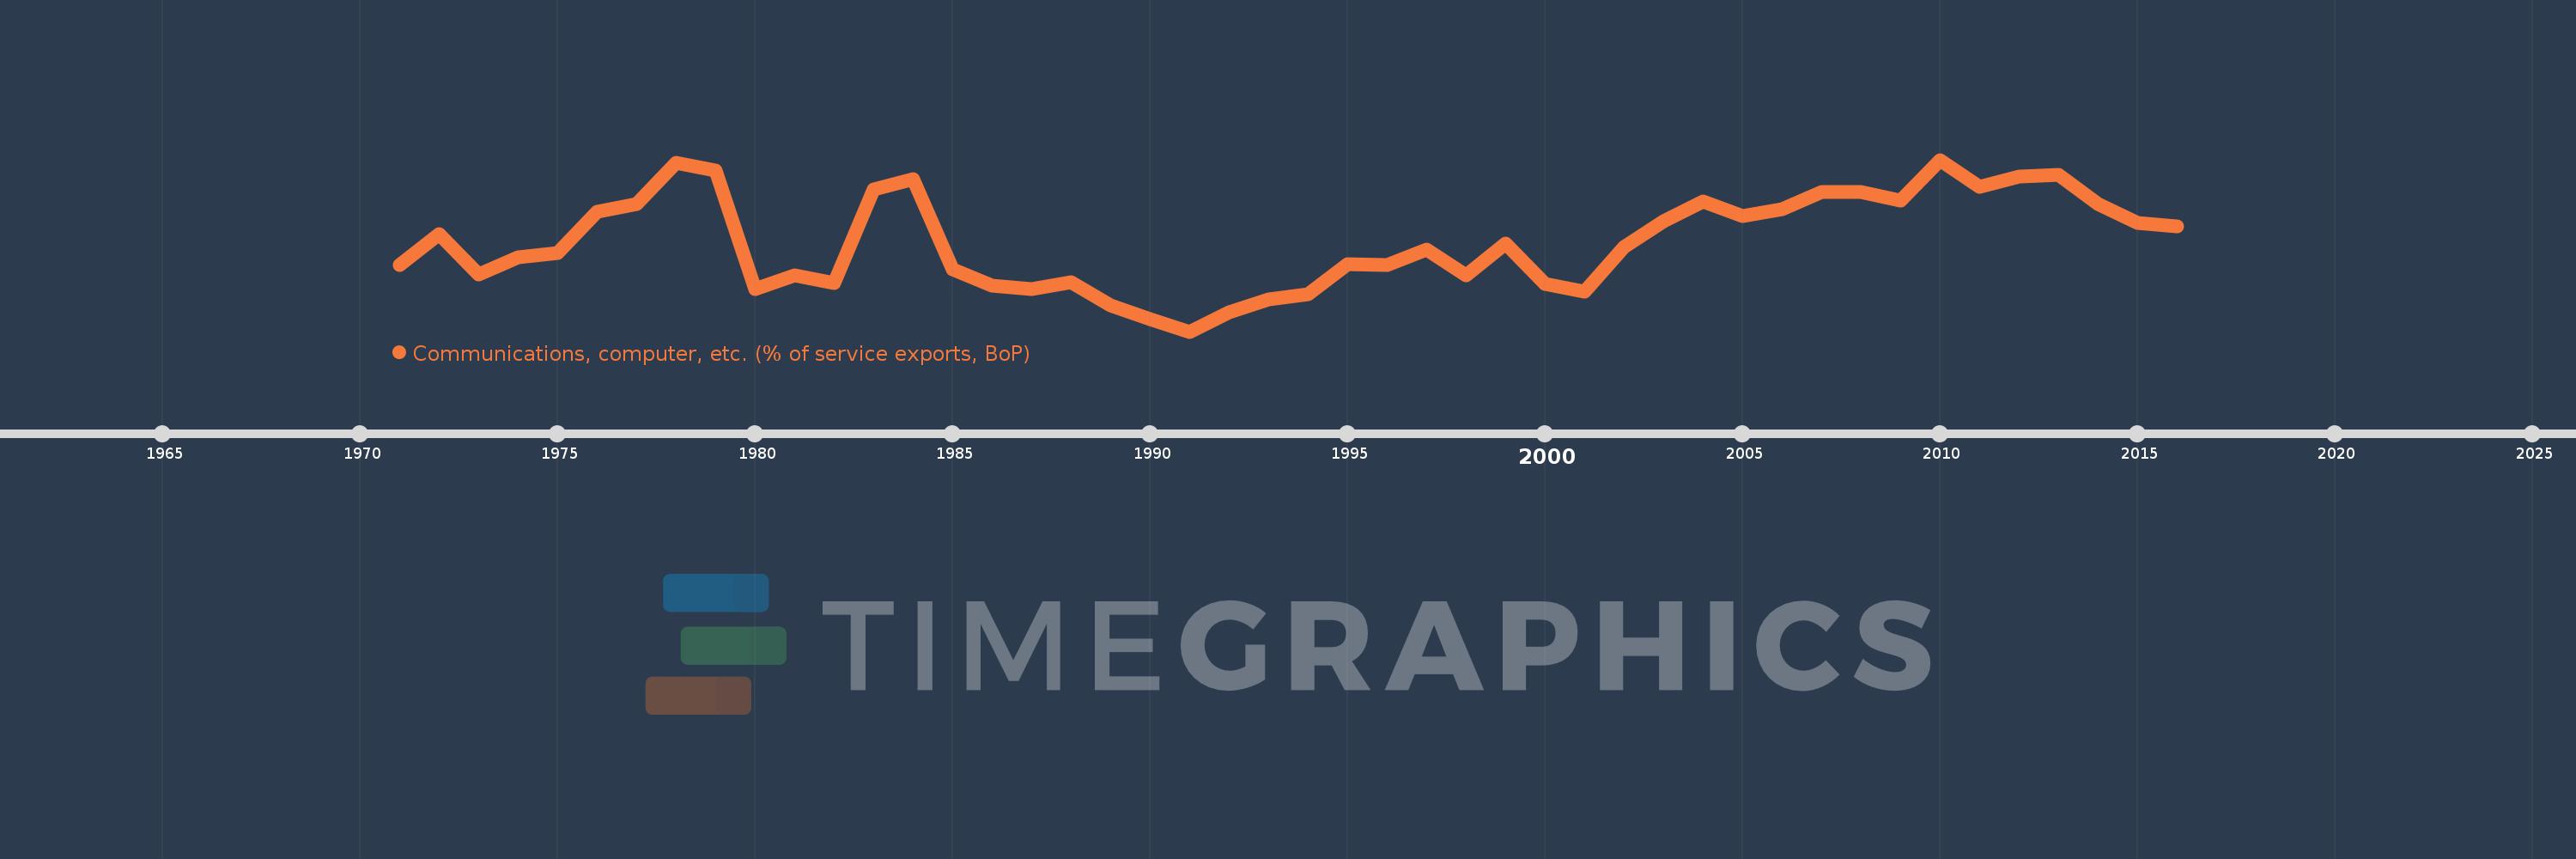
Communications, computer, etc. (% of service exports, BoP)
2016,2015,2014,2013,2012,2011,2010,2009,2008,2007,2006,2005,2004,2003,2002,2001,2000,1999,1998,1997,1996,1995,1994,1993,1992,1991,1990,1989,1988,1987,1986,1985,1984,1983,1982,1981,1980,1979,1978,1977,1976,1975,1974,1973,1972,1971
This statistics in other country:
AfghanistanAlbaniaAlgeriaAngolaAntigua and BarbudaArab WorldArgentinaArmeniaArubaAustraliaAustriaAzerbaijanBahamas, TheBahrainBangladeshBarbadosBelarusBelgiumBelizeBeninBermudaBhutanBoliviaBosnia and HerzegovinaBotswanaBrazilBrunei DarussalamBulgariaBurkina FasoBurundiCabo VerdeCambodiaCameroonCanadaCaribbean small statesCentral African RepublicCentral Europe and the BalticsChadChileChinaColombiaComorosCongo, Dem. Rep.Congo, Rep.Costa RicaCote d'IvoireCroatiaCuracaoCyprusCzech RepublicDenmarkDjiboutiDominicaDominican RepublicEarly-demographic dividendEast Asia & PacificEast Asia & Pacific (excluding high income)East Asia & Pacific (IDA & IBRD countries)EcuadorEgypt, Arab Rep.El SalvadorEquatorial GuineaEritreaEstoniaEthiopiaEuro areaEurope & Central AsiaEurope & Central Asia (excluding high income)Europe & Central Asia (IDA & IBRD countries)European UnionFaroe IslandsFijiFinlandFragile and conflict affected situationsFranceFrench PolynesiaGabonGambia, TheGeorgiaGermanyGhanaGreeceGrenadaGuatemalaGuineaGuinea-BissauGuyanaHaitiHeavily indebted poor countries (HIPC)High incomeHondurasHong Kong SAR, ChinaHungaryIBRD onlyIcelandIDA & IBRD totalIDA onlyIDA totalIndiaIndonesiaIran, Islamic Rep.IraqIrelandIsraelItalyJamaicaJapanJordanKazakhstanKenyaKiribatiKorea, Rep.KosovoKuwaitKyrgyz RepublicLao PDRLate-demographic dividendLatin America & Caribbean Latin America & Caribbean (excluding high income)Latin America & the Caribbean (IDA & IBRD countries)LatviaLeast developed countries: UN classificationLebanonLesothoLiberiaLibyaLithuaniaLow & middle incomeLow incomeLower middle incomeLuxembourgMacao SAR, ChinaMacedonia, FYRMadagascarMalawiMalaysiaMaldivesMaliMaltaMarshall IslandsMauritaniaMauritiusMexicoMicronesia, Fed. Sts.Middle East & North AfricaMiddle East & North Africa (excluding high income)Middle East & North Africa (IDA & IBRD countries)Middle incomeMoldovaMongoliaMontenegroMoroccoMozambiqueMyanmarNamibiaNepalNetherlandsNew CaledoniaNew ZealandNicaraguaNigerNigeriaNorth AmericaNorwayOECD membersOmanOther small statesPacific island small statesPakistanPalauPanamaPapua New GuineaParaguayPeruPhilippinesPolandPortugalPost-demographic dividendPre-demographic dividendQatarRomaniaRussian FederationRwandaSamoaSao Tome and PrincipeSaudi ArabiaSenegalSerbiaSeychellesSierra LeoneSingaporeSint Maarten (Dutch part)Slovak RepublicSloveniaSmall statesSolomon IslandsSouth AfricaSouth AsiaSouth Asia (IDA & IBRD)South SudanSpainSri LankaSt. Kitts and NevisSt. LuciaSt. Vincent and the GrenadinesSub-Saharan Africa Sub-Saharan Africa (excluding high income)Sub-Saharan Africa (IDA & IBRD countries)SudanSurinameSwazilandSwedenSwitzerlandSyrian Arab RepublicTajikistanTanzaniaThailandTimor-LesteTogoTongaTrinidad and TobagoTunisiaTurkeyTuvaluUgandaUkraineUnited KingdomUnited StatesUpper middle incomeUruguayVanuatuVenezuela, RBWest Bank and GazaWorldYemen, Rep.ZambiaZimbabwe Timeline:
This timeline shows a graph from 1971 to 2016 of North America. No data until 1970. Number of actual observations by date: 46.
Source name:
World Development Indicators
Source organization:
International Monetary Fund, Balance of Payments Statistics Yearbook and data files.
Categories, topics:
Economy & Growth, Trade
Last updated:
apr 23, 2017
Indicators value changes by year
Minimum:
39.325
jan 1, 1991
Maximum:
50.008
jan 1, 2010
At the date of observation
Value
Absolute change
Change from previous value
jan 1, 1971
43.441
+43.441
0.0%
jan 1, 1972
45.405
+1.964
4.52%
jan 1, 1973
42.856
-2.549
-5.61%
jan 1, 1974
43.945
+1.089
2.54%
jan 1, 1975
44.217
+0.272
0.62%
jan 1, 1976
46.787
+2.571
5.81%
jan 1, 1977
47.239
+0.452
0.97%
jan 1, 1978
49.847
+2.608
5.52%
jan 1, 1979
49.34
-0.507
-1.02%
jan 1, 1980
41.953
-7.387
-14.97%
jan 1, 1981
42.836
+0.883
2.1%
jan 1, 1982
42.357
-0.479
-1.12%
jan 1, 1983
48.18
+5.823
13.75%
jan 1, 1984
48.814
+0.634
1.32%
jan 1, 1985
43.185
-5.629
-11.53%
jan 1, 1986
42.172
-1.012
-2.34%
jan 1, 1987
41.994
-0.178
-0.42%
jan 1, 1988
42.406
+0.412
0.98%
jan 1, 1989
40.93
-1.476
-3.48%
jan 1, 1990
40.1
-0.829
-2.03%
jan 1, 1991
39.325
-0.776
-1.93%
jan 1, 1992
40.531
+1.207
3.07%
jan 1, 1993
41.344
+0.812
2.0%
jan 1, 1994
41.648
+0.304
0.74%
jan 1, 1995
43.542
+1.894
4.55%
jan 1, 1996
43.483
-0.059
-0.14%
jan 1, 1997
44.423
+0.939
2.16%
jan 1, 1998
42.84
-1.582
-3.56%
jan 1, 1999
44.799
+1.958
4.57%
jan 1, 2000
42.313
-2.485
-5.55%
jan 1, 2001
41.791
-0.522
-1.23%
jan 1, 2002
44.582
+2.791
6.68%
jan 1, 2003
46.178
+1.596
3.58%
jan 1, 2004
47.42
+1.241
2.69%
jan 1, 2005
46.502
-0.917
-1.93%
jan 1, 2006
46.934
+0.432
0.93%
jan 1, 2007
48.02
+1.086
2.31%
jan 1, 2008
48.012
-0.008
-0.02%
jan 1, 2009
47.487
-0.525
-1.09%
jan 1, 2010
50.008
+2.521
5.31%
jan 1, 2011
48.303
-1.704
-3.41%
jan 1, 2012
48.952
+0.649
1.34%
jan 1, 2013
49.055
+0.103
0.21%
jan 1, 2014
47.273
-1.781
-3.63%
jan 1, 2015
46.1
-1.173
-2.48%
jan 1, 2016
45.886
-0.214
-0.46%
Ranking of countries by current statistics by years


Comments: