29
/
en
AIzaSyAYiBZKx7MnpbEhh9jyipgxe19OcubqV5w
April 1, 2024
276467
United States
USA
true
2
1
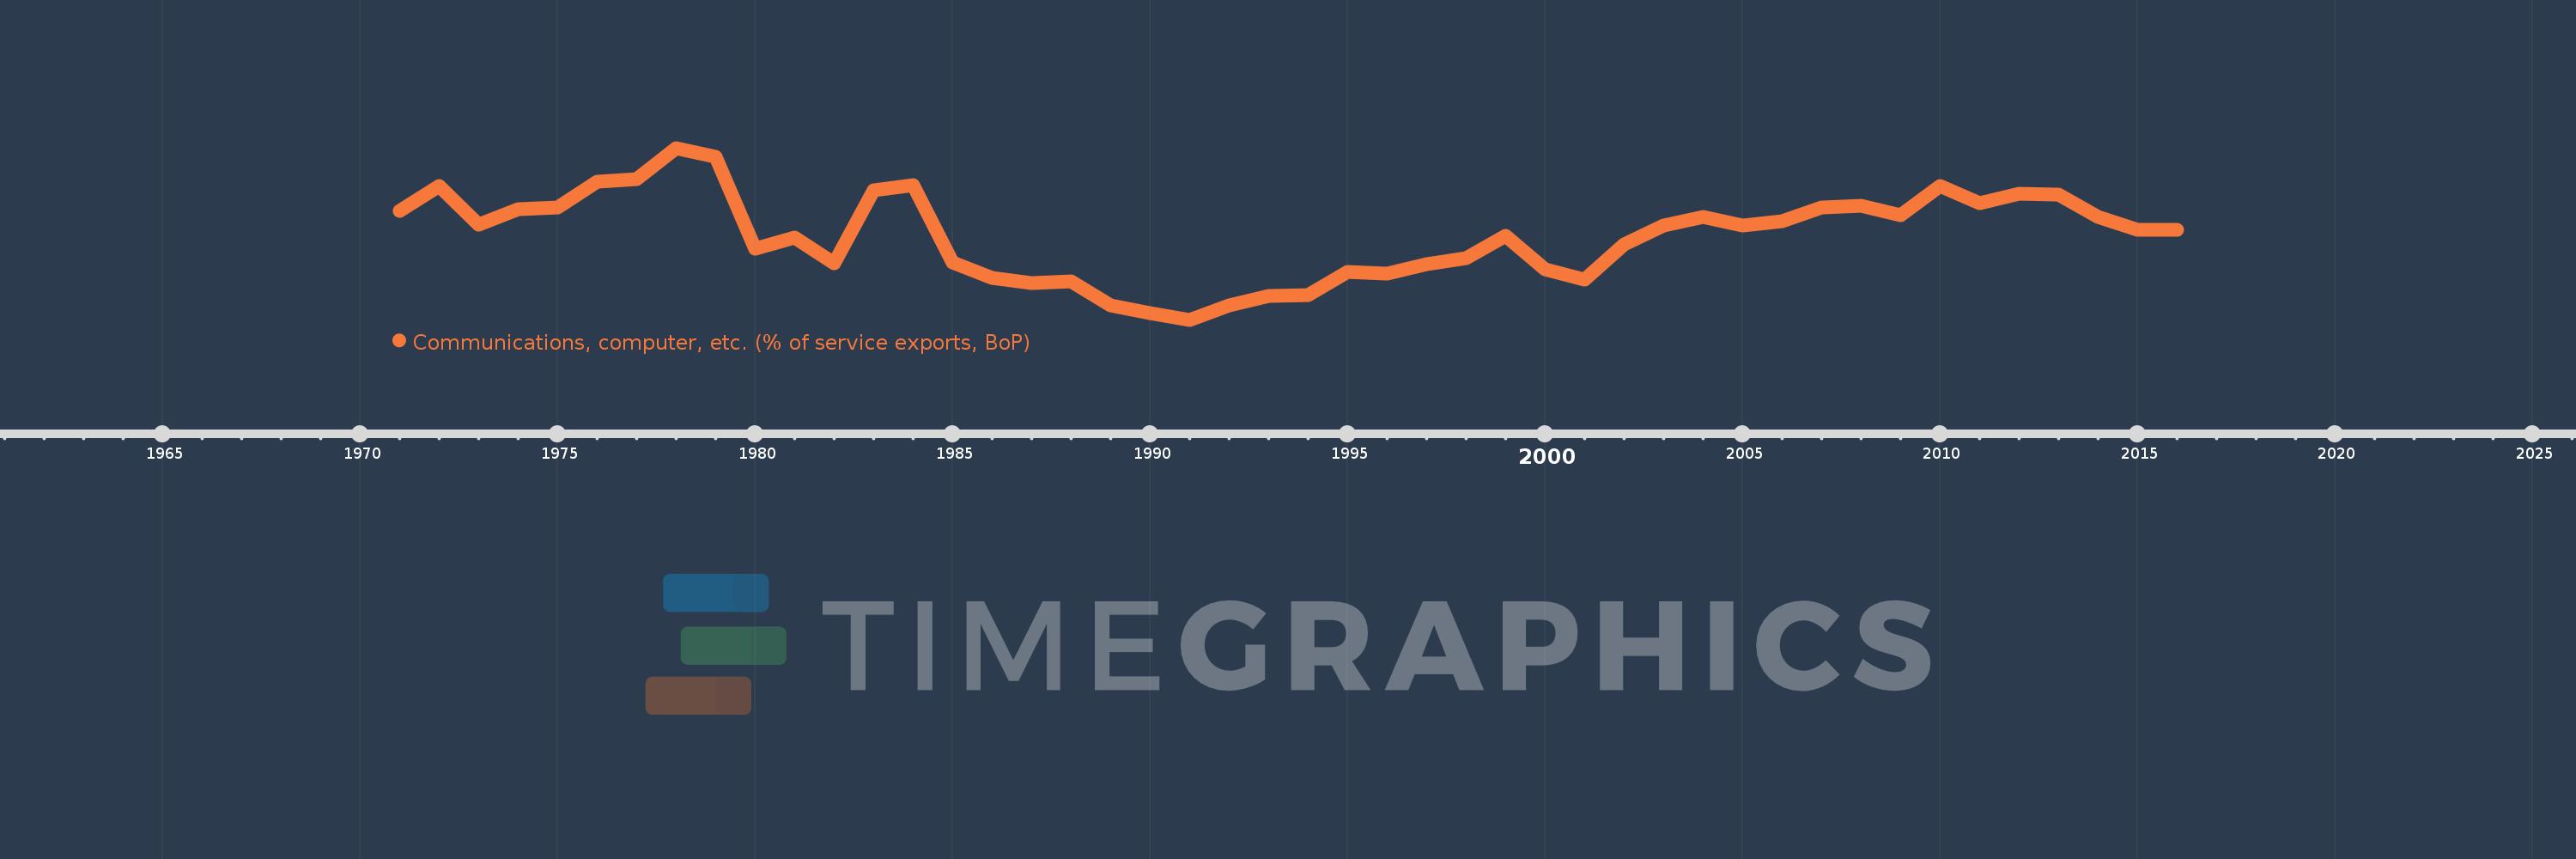
Communications, computer, etc. (% of service exports, BoP)
2016,2015,2014,2013,2012,2011,2010,2009,2008,2007,2006,2005,2004,2003,2002,2001,2000,1999,1998,1997,1996,1995,1994,1993,1992,1991,1990,1989,1988,1987,1986,1985,1984,1983,1982,1981,1980,1979,1978,1977,1976,1975,1974,1973,1972,1971
This statistics in other country:
AfghanistanAlbaniaAlgeriaAngolaAntigua and BarbudaArab WorldArgentinaArmeniaArubaAustraliaAustriaAzerbaijanBahamas, TheBahrainBangladeshBarbadosBelarusBelgiumBelizeBeninBermudaBhutanBoliviaBosnia and HerzegovinaBotswanaBrazilBrunei DarussalamBulgariaBurkina FasoBurundiCabo VerdeCambodiaCameroonCanadaCaribbean small statesCentral African RepublicCentral Europe and the BalticsChadChileChinaColombiaComorosCongo, Dem. Rep.Congo, Rep.Costa RicaCote d'IvoireCroatiaCuracaoCyprusCzech RepublicDenmarkDjiboutiDominicaDominican RepublicEarly-demographic dividendEast Asia & PacificEast Asia & Pacific (excluding high income)East Asia & Pacific (IDA & IBRD countries)EcuadorEgypt, Arab Rep.El SalvadorEquatorial GuineaEritreaEstoniaEthiopiaEuro areaEurope & Central AsiaEurope & Central Asia (excluding high income)Europe & Central Asia (IDA & IBRD countries)European UnionFaroe IslandsFijiFinlandFragile and conflict affected situationsFranceFrench PolynesiaGabonGambia, TheGeorgiaGermanyGhanaGreeceGrenadaGuatemalaGuineaGuinea-BissauGuyanaHaitiHeavily indebted poor countries (HIPC)High incomeHondurasHong Kong SAR, ChinaHungaryIBRD onlyIcelandIDA & IBRD totalIDA onlyIDA totalIndiaIndonesiaIran, Islamic Rep.IraqIrelandIsraelItalyJamaicaJapanJordanKazakhstanKenyaKiribatiKorea, Rep.KosovoKuwaitKyrgyz RepublicLao PDRLate-demographic dividendLatin America & Caribbean Latin America & Caribbean (excluding high income)Latin America & the Caribbean (IDA & IBRD countries)LatviaLeast developed countries: UN classificationLebanonLesothoLiberiaLibyaLithuaniaLow & middle incomeLow incomeLower middle incomeLuxembourgMacao SAR, ChinaMacedonia, FYRMadagascarMalawiMalaysiaMaldivesMaliMaltaMarshall IslandsMauritaniaMauritiusMexicoMicronesia, Fed. Sts.Middle East & North AfricaMiddle East & North Africa (excluding high income)Middle East & North Africa (IDA & IBRD countries)Middle incomeMoldovaMongoliaMontenegroMoroccoMozambiqueMyanmarNamibiaNepalNetherlandsNew CaledoniaNew ZealandNicaraguaNigerNigeriaNorth AmericaNorwayOECD membersOmanOther small statesPacific island small statesPakistanPalauPanamaPapua New GuineaParaguayPeruPhilippinesPolandPortugalPost-demographic dividendPre-demographic dividendQatarRomaniaRussian FederationRwandaSamoaSao Tome and PrincipeSaudi ArabiaSenegalSerbiaSeychellesSierra LeoneSingaporeSint Maarten (Dutch part)Slovak RepublicSloveniaSmall statesSolomon IslandsSouth AfricaSouth AsiaSouth Asia (IDA & IBRD)South SudanSpainSri LankaSt. Kitts and NevisSt. LuciaSt. Vincent and the GrenadinesSub-Saharan Africa Sub-Saharan Africa (excluding high income)Sub-Saharan Africa (IDA & IBRD countries)SudanSurinameSwazilandSwedenSwitzerlandSyrian Arab RepublicTajikistanTanzaniaThailandTimor-LesteTogoTongaTrinidad and TobagoTunisiaTurkeyTuvaluUgandaUkraineUnited KingdomUnited StatesUpper middle incomeUruguayVanuatuVenezuela, RBWest Bank and GazaWorldYemen, Rep.ZambiaZimbabwe Timeline:
This timeline shows a graph from 1971 to 2016 of United States. No data until 1970. Number of actual observations by date: 46.
Source name:
World Development Indicators
Source organization:
International Monetary Fund, Balance of Payments Statistics Yearbook and data files.
Categories, topics:
Economy & Growth, Trade
Last updated:
apr 23, 2017
Indicators value changes by year
Maximum:
52.396
jan 1, 1978
At the date of observation
Value
Absolute change
Change from previous value
jan 1, 1971
46.9
+46.9
0.0%
jan 1, 1972
49.063
+2.163
4.61%
jan 1, 1973
45.693
-3.37
-6.87%
jan 1, 1974
47.007
+1.314
2.88%
jan 1, 1975
47.183
+0.176
0.38%
jan 1, 1976
49.421
+2.238
4.74%
jan 1, 1977
49.637
+0.216
0.44%
jan 1, 1978
52.396
+2.759
5.56%
jan 1, 1979
51.65
-0.746
-1.42%
jan 1, 1980
43.576
-8.074
-15.63%
jan 1, 1981
44.585
+1.008
2.31%
jan 1, 1982
42.341
-2.244
-5.03%
jan 1, 1983
48.664
+6.323
14.93%
jan 1, 1984
49.128
+0.464
0.95%
jan 1, 1985
42.425
-6.703
-13.64%
jan 1, 1986
41.071
-1.354
-3.19%
jan 1, 1987
40.598
-0.473
-1.15%
jan 1, 1988
40.728
+0.13
0.32%
jan 1, 1989
38.643
-2.085
-5.12%
jan 1, 1990
37.966
-0.677
-1.75%
jan 1, 1991
37.38
-0.586
-1.54%
jan 1, 1992
38.634
+1.254
3.35%
jan 1, 1993
39.459
+0.825
2.14%
jan 1, 1994
39.507
+0.048
0.12%
jan 1, 1995
41.579
+2.071
5.24%
jan 1, 1996
41.411
-0.167
-0.4%
jan 1, 1997
42.21
+0.799
1.93%
jan 1, 1998
42.731
+0.521
1.24%
jan 1, 1999
44.71
+1.979
4.63%
jan 1, 2000
41.756
-2.954
-6.61%
jan 1, 2001
40.873
-0.883
-2.11%
jan 1, 2002
43.946
+3.072
7.52%
jan 1, 2003
45.598
+1.652
3.76%
jan 1, 2004
46.342
+0.745
1.63%
jan 1, 2005
45.613
-0.73
-1.57%
jan 1, 2006
45.97
+0.358
0.78%
jan 1, 2007
47.226
+1.256
2.73%
jan 1, 2008
47.363
+0.137
0.29%
jan 1, 2009
46.48
-0.883
-1.86%
jan 1, 2010
49.073
+2.593
5.58%
jan 1, 2011
47.56
-1.513
-3.08%
jan 1, 2012
48.377
+0.817
1.72%
jan 1, 2013
48.347
-0.03
-0.06%
jan 1, 2014
46.385
-1.962
-4.06%
jan 1, 2015
45.234
-1.15
-2.48%
jan 1, 2016
45.216
-0.018
-0.04%
Ranking of countries by current statistics by years


Comments: