29
/
en
AIzaSyAYiBZKx7MnpbEhh9jyipgxe19OcubqV5w
April 1, 2024
33301
European Union
EUU
false
2
1
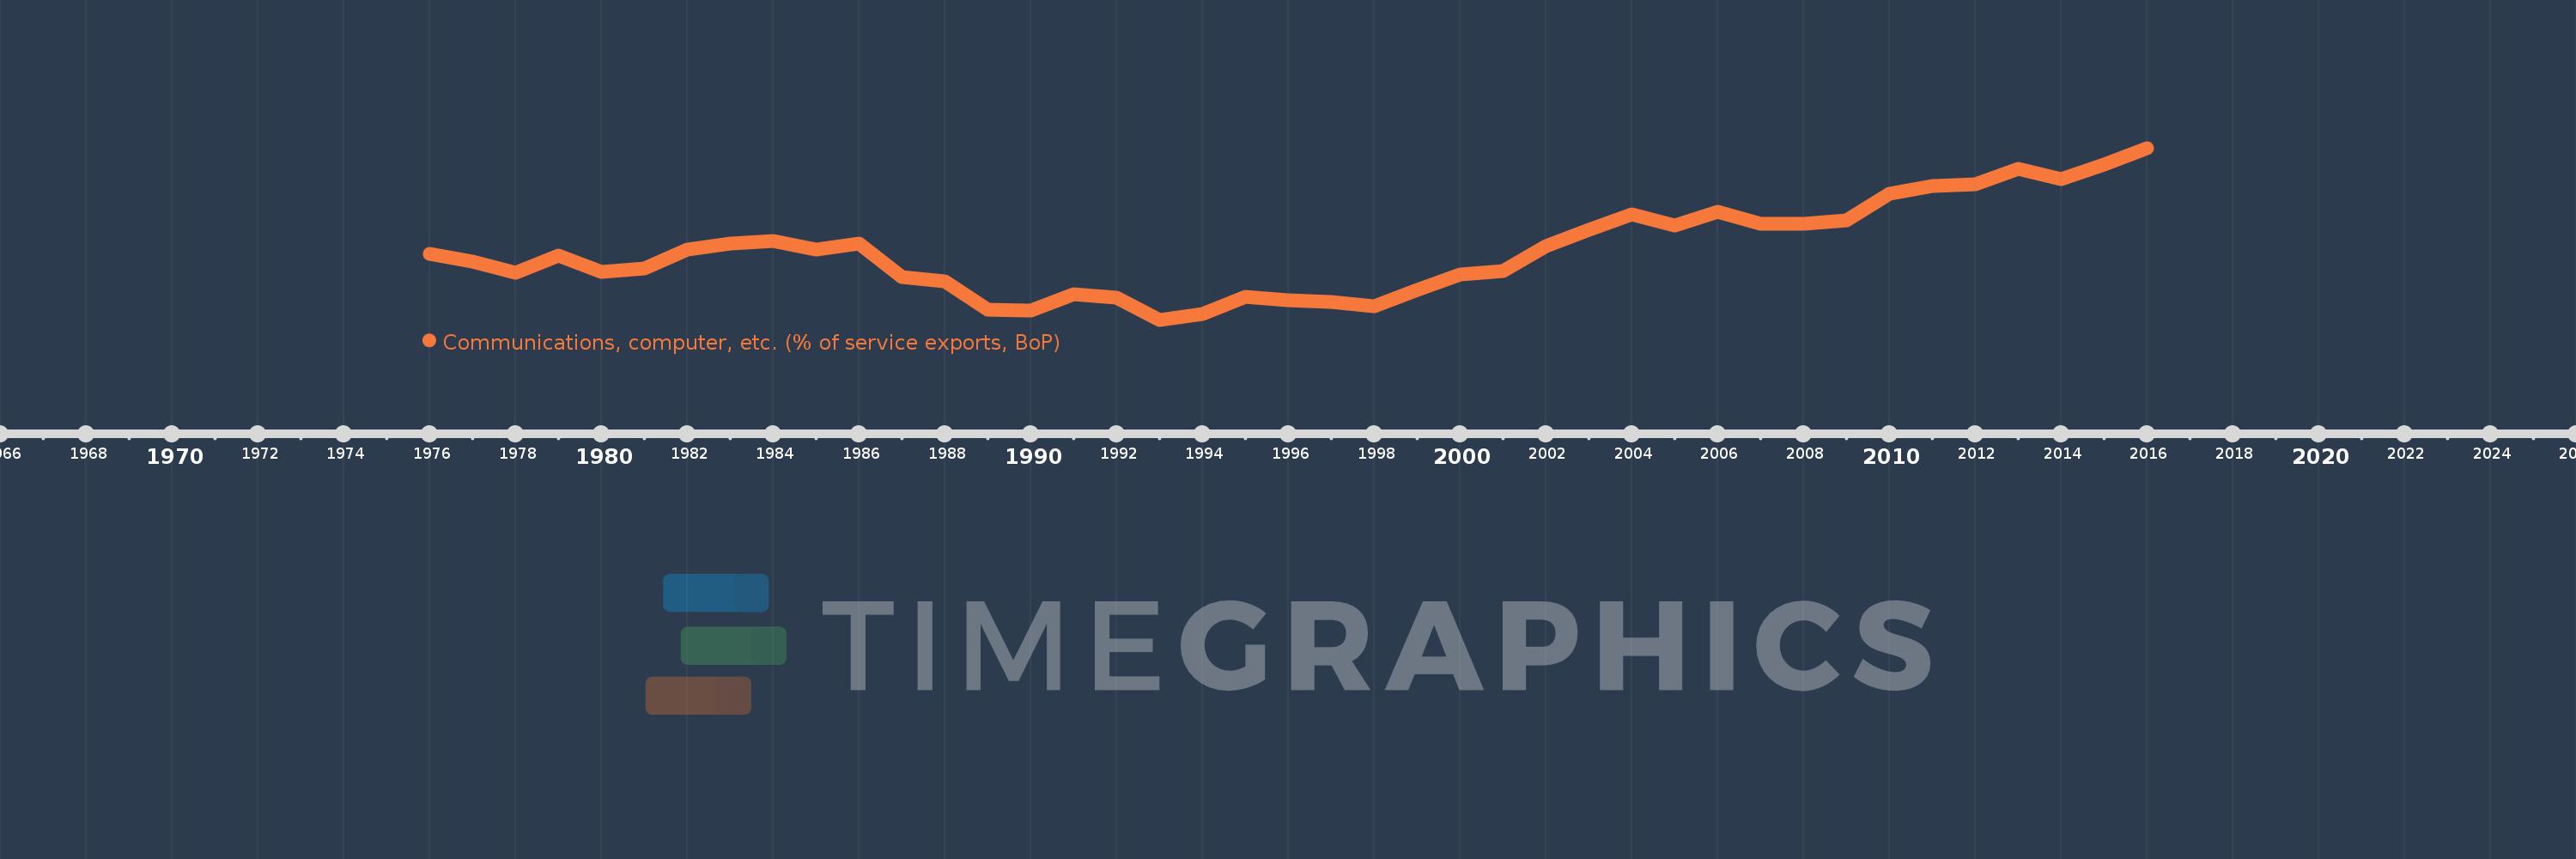
Communications, computer, etc. (% of service exports, BoP)
2016,2015,2014,2013,2012,2011,2010,2009,2008,2007,2006,2005,2004,2003,2002,2001,2000,1999,1998,1997,1996,1995,1994,1993,1992,1991,1990,1989,1988,1987,1986,1985,1984,1983,1982,1981,1980,1979,1978,1977,1976
This statistics in other country:
AfghanistanAlbaniaAlgeriaAngolaAntigua and BarbudaArab WorldArgentinaArmeniaArubaAustraliaAustriaAzerbaijanBahamas, TheBahrainBangladeshBarbadosBelarusBelgiumBelizeBeninBermudaBhutanBoliviaBosnia and HerzegovinaBotswanaBrazilBrunei DarussalamBulgariaBurkina FasoBurundiCabo VerdeCambodiaCameroonCanadaCaribbean small statesCentral African RepublicCentral Europe and the BalticsChadChileChinaColombiaComorosCongo, Dem. Rep.Congo, Rep.Costa RicaCote d'IvoireCroatiaCuracaoCyprusCzech RepublicDenmarkDjiboutiDominicaDominican RepublicEarly-demographic dividendEast Asia & PacificEast Asia & Pacific (excluding high income)East Asia & Pacific (IDA & IBRD countries)EcuadorEgypt, Arab Rep.El SalvadorEquatorial GuineaEritreaEstoniaEthiopiaEuro areaEurope & Central AsiaEurope & Central Asia (excluding high income)Europe & Central Asia (IDA & IBRD countries)European UnionFaroe IslandsFijiFinlandFragile and conflict affected situationsFranceFrench PolynesiaGabonGambia, TheGeorgiaGermanyGhanaGreeceGrenadaGuatemalaGuineaGuinea-BissauGuyanaHaitiHeavily indebted poor countries (HIPC)High incomeHondurasHong Kong SAR, ChinaHungaryIBRD onlyIcelandIDA & IBRD totalIDA onlyIDA totalIndiaIndonesiaIran, Islamic Rep.IraqIrelandIsraelItalyJamaicaJapanJordanKazakhstanKenyaKiribatiKorea, Rep.KosovoKuwaitKyrgyz RepublicLao PDRLate-demographic dividendLatin America & Caribbean Latin America & Caribbean (excluding high income)Latin America & the Caribbean (IDA & IBRD countries)LatviaLeast developed countries: UN classificationLebanonLesothoLiberiaLibyaLithuaniaLow & middle incomeLow incomeLower middle incomeLuxembourgMacao SAR, ChinaMacedonia, FYRMadagascarMalawiMalaysiaMaldivesMaliMaltaMarshall IslandsMauritaniaMauritiusMexicoMicronesia, Fed. Sts.Middle East & North AfricaMiddle East & North Africa (excluding high income)Middle East & North Africa (IDA & IBRD countries)Middle incomeMoldovaMongoliaMontenegroMoroccoMozambiqueMyanmarNamibiaNepalNetherlandsNew CaledoniaNew ZealandNicaraguaNigerNigeriaNorth AmericaNorwayOECD membersOmanOther small statesPacific island small statesPakistanPalauPanamaPapua New GuineaParaguayPeruPhilippinesPolandPortugalPost-demographic dividendPre-demographic dividendQatarRomaniaRussian FederationRwandaSamoaSao Tome and PrincipeSaudi ArabiaSenegalSerbiaSeychellesSierra LeoneSingaporeSint Maarten (Dutch part)Slovak RepublicSloveniaSmall statesSolomon IslandsSouth AfricaSouth AsiaSouth Asia (IDA & IBRD)South SudanSpainSri LankaSt. Kitts and NevisSt. LuciaSt. Vincent and the GrenadinesSub-Saharan Africa Sub-Saharan Africa (excluding high income)Sub-Saharan Africa (IDA & IBRD countries)SudanSurinameSwazilandSwedenSwitzerlandSyrian Arab RepublicTajikistanTanzaniaThailandTimor-LesteTogoTongaTrinidad and TobagoTunisiaTurkeyTuvaluUgandaUkraineUnited KingdomUnited StatesUpper middle incomeUruguayVanuatuVenezuela, RBWest Bank and GazaWorldYemen, Rep.ZambiaZimbabwe Timeline:
This timeline shows a graph from 1976 to 2016 of European Union. No data until 1975. Number of actual observations by date: 41.
Source name:
World Development Indicators
Source organization:
International Monetary Fund, Balance of Payments Statistics Yearbook and data files.
Categories, topics:
Economy & Growth, Trade
Last updated:
apr 23, 2017
Indicators value changes by year
Minimum:
35.007
jan 1, 1993
Maximum:
49.609
jan 1, 2016
At the date of observation
Value
Absolute change
Change from previous value
jan 1, 1976
40.626
+40.626
0.0%
jan 1, 1977
39.929
-0.696
-1.71%
jan 1, 1978
38.971
-0.958
-2.4%
jan 1, 1979
40.476
+1.506
3.86%
jan 1, 1980
39.084
-1.392
-3.44%
jan 1, 1981
39.379
+0.295
0.75%
jan 1, 1982
41.007
+1.628
4.13%
jan 1, 1983
41.482
+0.474
1.16%
jan 1, 1984
41.676
+0.194
0.47%
jan 1, 1985
40.983
-0.693
-1.66%
jan 1, 1986
41.462
+0.479
1.17%
jan 1, 1987
38.644
-2.819
-6.8%
jan 1, 1988
38.286
-0.357
-0.92%
jan 1, 1989
35.825
-2.462
-6.43%
jan 1, 1990
35.757
-0.067
-0.19%
jan 1, 1991
37.164
+1.407
3.93%
jan 1, 1992
36.891
-0.273
-0.74%
jan 1, 1993
35.007
-1.884
-5.11%
jan 1, 1994
35.461
+0.454
1.3%
jan 1, 1995
36.953
+1.492
4.21%
jan 1, 1996
36.662
-0.291
-0.79%
jan 1, 1997
36.485
-0.177
-0.48%
jan 1, 1998
36.13
-0.355
-0.97%
jan 1, 1999
37.551
+1.421
3.93%
jan 1, 2000
38.889
+1.338
3.56%
jan 1, 2001
39.151
+0.262
0.67%
jan 1, 2002
41.296
+2.145
5.48%
jan 1, 2003
42.654
+1.358
3.29%
jan 1, 2004
43.93
+1.276
2.99%
jan 1, 2005
42.988
-0.942
-2.14%
jan 1, 2006
44.209
+1.221
2.84%
jan 1, 2007
43.135
-1.073
-2.43%
jan 1, 2008
43.144
+0.009
0.02%
jan 1, 2009
43.467
+0.323
0.75%
jan 1, 2010
45.686
+2.219
5.1%
jan 1, 2011
46.361
+0.675
1.48%
jan 1, 2012
46.496
+0.135
0.29%
jan 1, 2013
47.859
+1.364
2.93%
jan 1, 2014
46.947
-0.912
-1.91%
jan 1, 2015
48.236
+1.289
2.75%
jan 1, 2016
49.609
+1.374
2.85%
Ranking of countries by current statistics by years


Comments: