29
/
en
AIzaSyAYiBZKx7MnpbEhh9jyipgxe19OcubqV5w
April 1, 2024
235508
Senegal
SEN
true
2
1
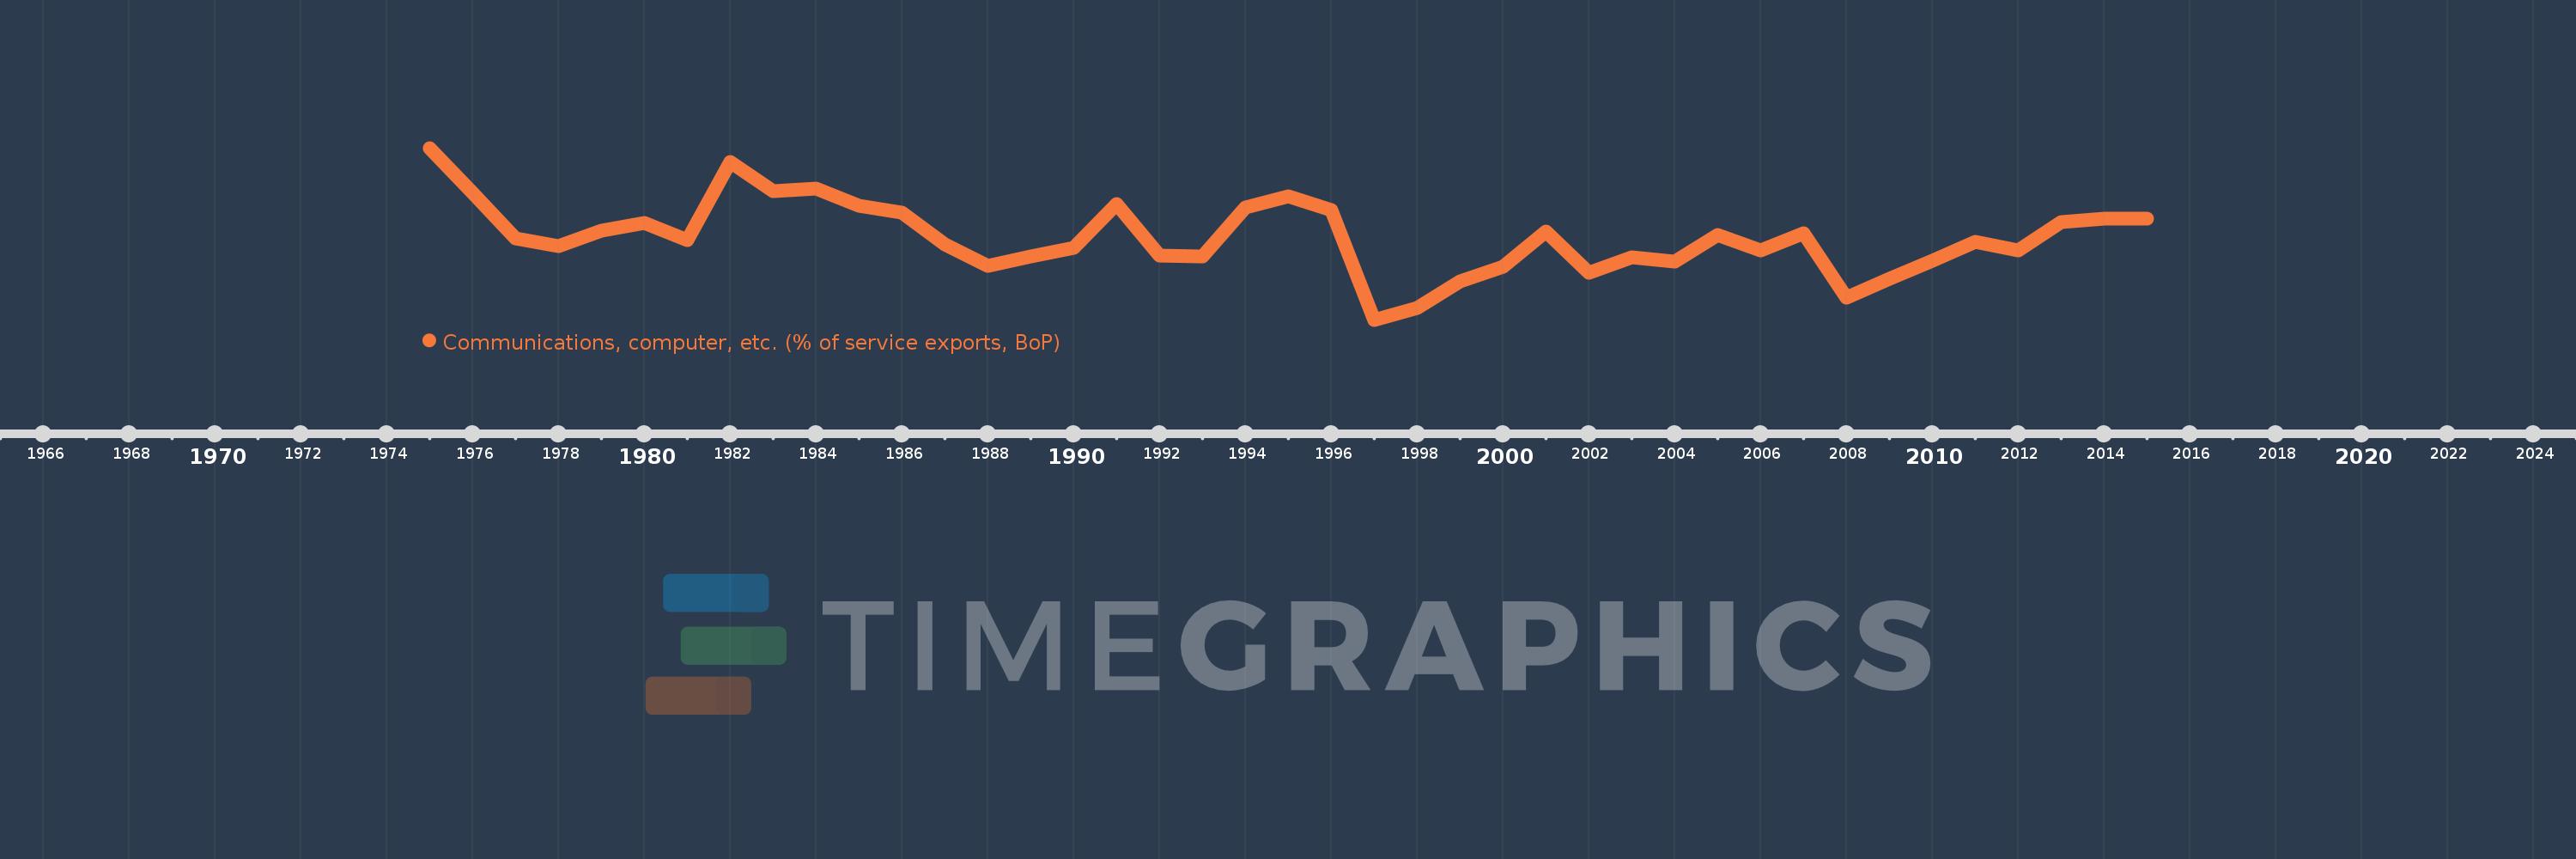
Communications, computer, etc. (% of service exports, BoP)
2015,2014,2013,2012,2011,2010,2009,2008,2007,2006,2005,2004,2003,2002,2001,2000,1999,1998,1997,1996,1995,1994,1993,1992,1991,1990,1989,1988,1987,1986,1985,1984,1983,1982,1981,1980,1979,1978,1977,1976,1975
This statistics in other country:
AfghanistanAlbaniaAlgeriaAngolaAntigua and BarbudaArab WorldArgentinaArmeniaArubaAustraliaAustriaAzerbaijanBahamas, TheBahrainBangladeshBarbadosBelarusBelgiumBelizeBeninBermudaBhutanBoliviaBosnia and HerzegovinaBotswanaBrazilBrunei DarussalamBulgariaBurkina FasoBurundiCabo VerdeCambodiaCameroonCanadaCaribbean small statesCentral African RepublicCentral Europe and the BalticsChadChileChinaColombiaComorosCongo, Dem. Rep.Congo, Rep.Costa RicaCote d'IvoireCroatiaCuracaoCyprusCzech RepublicDenmarkDjiboutiDominicaDominican RepublicEarly-demographic dividendEast Asia & PacificEast Asia & Pacific (excluding high income)East Asia & Pacific (IDA & IBRD countries)EcuadorEgypt, Arab Rep.El SalvadorEquatorial GuineaEritreaEstoniaEthiopiaEuro areaEurope & Central AsiaEurope & Central Asia (excluding high income)Europe & Central Asia (IDA & IBRD countries)European UnionFaroe IslandsFijiFinlandFragile and conflict affected situationsFranceFrench PolynesiaGabonGambia, TheGeorgiaGermanyGhanaGreeceGrenadaGuatemalaGuineaGuinea-BissauGuyanaHaitiHeavily indebted poor countries (HIPC)High incomeHondurasHong Kong SAR, ChinaHungaryIBRD onlyIcelandIDA & IBRD totalIDA onlyIDA totalIndiaIndonesiaIran, Islamic Rep.IraqIrelandIsraelItalyJamaicaJapanJordanKazakhstanKenyaKiribatiKorea, Rep.KosovoKuwaitKyrgyz RepublicLao PDRLate-demographic dividendLatin America & Caribbean Latin America & Caribbean (excluding high income)Latin America & the Caribbean (IDA & IBRD countries)LatviaLeast developed countries: UN classificationLebanonLesothoLiberiaLibyaLithuaniaLow & middle incomeLow incomeLower middle incomeLuxembourgMacao SAR, ChinaMacedonia, FYRMadagascarMalawiMalaysiaMaldivesMaliMaltaMarshall IslandsMauritaniaMauritiusMexicoMicronesia, Fed. Sts.Middle East & North AfricaMiddle East & North Africa (excluding high income)Middle East & North Africa (IDA & IBRD countries)Middle incomeMoldovaMongoliaMontenegroMoroccoMozambiqueMyanmarNamibiaNepalNetherlandsNew CaledoniaNew ZealandNicaraguaNigerNigeriaNorth AmericaNorwayOECD membersOmanOther small statesPacific island small statesPakistanPalauPanamaPapua New GuineaParaguayPeruPhilippinesPolandPortugalPost-demographic dividendPre-demographic dividendQatarRomaniaRussian FederationRwandaSamoaSao Tome and PrincipeSaudi ArabiaSenegalSerbiaSeychellesSierra LeoneSingaporeSint Maarten (Dutch part)Slovak RepublicSloveniaSmall statesSolomon IslandsSouth AfricaSouth AsiaSouth Asia (IDA & IBRD)South SudanSpainSri LankaSt. Kitts and NevisSt. LuciaSt. Vincent and the GrenadinesSub-Saharan Africa Sub-Saharan Africa (excluding high income)Sub-Saharan Africa (IDA & IBRD countries)SudanSurinameSwazilandSwedenSwitzerlandSyrian Arab RepublicTajikistanTanzaniaThailandTimor-LesteTogoTongaTrinidad and TobagoTunisiaTurkeyTuvaluUgandaUkraineUnited KingdomUnited StatesUpper middle incomeUruguayVanuatuVenezuela, RBWest Bank and GazaWorldYemen, Rep.ZambiaZimbabwe Timeline:
This timeline shows a graph from 1975 to 2015 of Senegal. No data until 1974. Number of actual observations by date: 41.
Source name:
World Development Indicators
Source organization:
International Monetary Fund, Balance of Payments Statistics Yearbook and data files.
Categories, topics:
Economy & Growth, Trade
Last updated:
apr 23, 2017
Indicators value changes by year
Minimum:
38.993
jan 1, 1997
At the date of observation
Value
Absolute change
Change from previous value
jan 1, 1975
65.47
+65.47
0.0%
jan 1, 1976
58.494
-6.976
-10.66%
jan 1, 1977
51.588
-6.906
-11.81%
jan 1, 1978
50.275
-1.312
-2.54%
jan 1, 1979
52.737
+2.462
4.9%
jan 1, 1980
53.92
+1.183
2.24%
jan 1, 1981
51.279
-2.641
-4.9%
jan 1, 1982
63.257
+11.978
23.36%
jan 1, 1983
58.795
-4.462
-7.05%
jan 1, 1984
59.257
+0.462
0.79%
jan 1, 1985
56.553
-2.704
-4.56%
jan 1, 1986
55.547
-1.007
-1.78%
jan 1, 1987
50.574
-4.972
-8.95%
jan 1, 1988
47.318
-3.256
-6.44%
jan 1, 1989
48.748
+1.43
3.02%
jan 1, 1990
50.008
+1.26
2.59%
jan 1, 1991
56.775
+6.767
13.53%
jan 1, 1992
48.933
-7.842
-13.81%
jan 1, 1993
48.705
-0.228
-0.47%
jan 1, 1994
56.28
+7.575
15.55%
jan 1, 1995
58.0
+1.72
3.06%
jan 1, 1996
55.87
-2.131
-3.67%
jan 1, 1997
38.993
-16.877
-30.21%
jan 1, 1998
40.868
+1.875
4.81%
jan 1, 1999
44.9
+4.032
9.86%
jan 1, 2000
47.118
+2.218
4.94%
jan 1, 2001
52.594
+5.476
11.62%
jan 1, 2002
46.26
-6.334
-12.04%
jan 1, 2003
48.571
+2.311
5.0%
jan 1, 2004
47.986
-0.585
-1.2%
jan 1, 2005
52.021
+4.036
8.41%
jan 1, 2006
49.63
-2.391
-4.6%
jan 1, 2007
52.359
+2.729
5.5%
jan 1, 2008
42.377
-9.982
-19.07%
jan 1, 2009
45.273
+2.896
6.83%
jan 1, 2010
48.144
+2.871
6.34%
jan 1, 2011
51.036
+2.892
6.01%
jan 1, 2012
49.695
-1.341
-2.63%
jan 1, 2013
54.054
+4.359
8.77%
jan 1, 2014
54.593
+0.539
1.0%
jan 1, 2015
54.616
+0.023
0.04%
Ranking of countries by current statistics by years


Comments: