29
/
en
AIzaSyAYiBZKx7MnpbEhh9jyipgxe19OcubqV5w
April 1, 2024
221948
Peru
PER
true
2
1
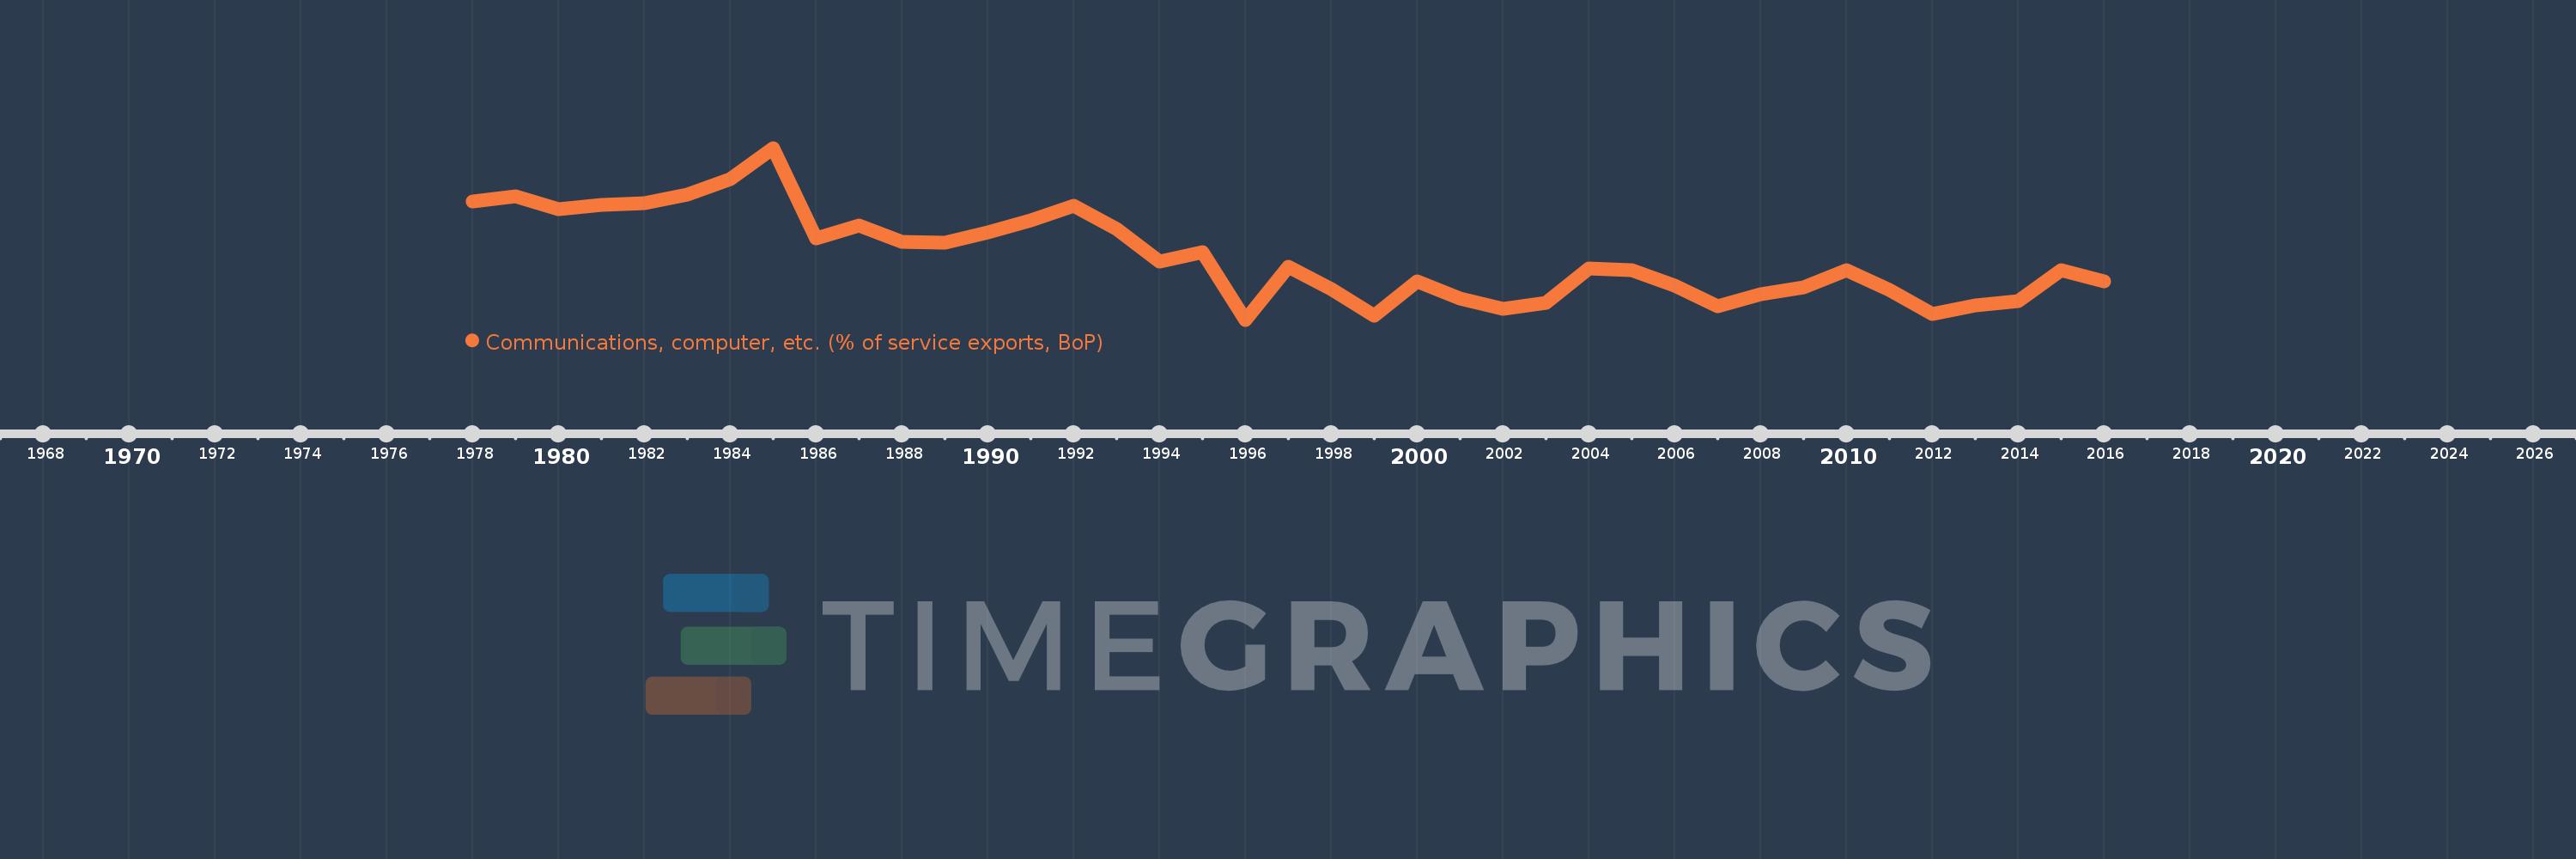
Communications, computer, etc. (% of service exports, BoP)
2016,2015,2014,2013,2012,2011,2010,2009,2008,2007,2006,2005,2004,2003,2002,2001,2000,1999,1998,1997,1996,1995,1994,1993,1992,1991,1990,1989,1988,1987,1986,1985,1984,1983,1982,1981,1980,1979,1978
This statistics in other country:
AfghanistanAlbaniaAlgeriaAngolaAntigua and BarbudaArab WorldArgentinaArmeniaArubaAustraliaAustriaAzerbaijanBahamas, TheBahrainBangladeshBarbadosBelarusBelgiumBelizeBeninBermudaBhutanBoliviaBosnia and HerzegovinaBotswanaBrazilBrunei DarussalamBulgariaBurkina FasoBurundiCabo VerdeCambodiaCameroonCanadaCaribbean small statesCentral African RepublicCentral Europe and the BalticsChadChileChinaColombiaComorosCongo, Dem. Rep.Congo, Rep.Costa RicaCote d'IvoireCroatiaCuracaoCyprusCzech RepublicDenmarkDjiboutiDominicaDominican RepublicEarly-demographic dividendEast Asia & PacificEast Asia & Pacific (excluding high income)East Asia & Pacific (IDA & IBRD countries)EcuadorEgypt, Arab Rep.El SalvadorEquatorial GuineaEritreaEstoniaEthiopiaEuro areaEurope & Central AsiaEurope & Central Asia (excluding high income)Europe & Central Asia (IDA & IBRD countries)European UnionFaroe IslandsFijiFinlandFragile and conflict affected situationsFranceFrench PolynesiaGabonGambia, TheGeorgiaGermanyGhanaGreeceGrenadaGuatemalaGuineaGuinea-BissauGuyanaHaitiHeavily indebted poor countries (HIPC)High incomeHondurasHong Kong SAR, ChinaHungaryIBRD onlyIcelandIDA & IBRD totalIDA onlyIDA totalIndiaIndonesiaIran, Islamic Rep.IraqIrelandIsraelItalyJamaicaJapanJordanKazakhstanKenyaKiribatiKorea, Rep.KosovoKuwaitKyrgyz RepublicLao PDRLate-demographic dividendLatin America & Caribbean Latin America & Caribbean (excluding high income)Latin America & the Caribbean (IDA & IBRD countries)LatviaLeast developed countries: UN classificationLebanonLesothoLiberiaLibyaLithuaniaLow & middle incomeLow incomeLower middle incomeLuxembourgMacao SAR, ChinaMacedonia, FYRMadagascarMalawiMalaysiaMaldivesMaliMaltaMarshall IslandsMauritaniaMauritiusMexicoMicronesia, Fed. Sts.Middle East & North AfricaMiddle East & North Africa (excluding high income)Middle East & North Africa (IDA & IBRD countries)Middle incomeMoldovaMongoliaMontenegroMoroccoMozambiqueMyanmarNamibiaNepalNetherlandsNew CaledoniaNew ZealandNicaraguaNigerNigeriaNorth AmericaNorwayOECD membersOmanOther small statesPacific island small statesPakistanPalauPanamaPapua New GuineaParaguayPeruPhilippinesPolandPortugalPost-demographic dividendPre-demographic dividendQatarRomaniaRussian FederationRwandaSamoaSao Tome and PrincipeSaudi ArabiaSenegalSerbiaSeychellesSierra LeoneSingaporeSint Maarten (Dutch part)Slovak RepublicSloveniaSmall statesSolomon IslandsSouth AfricaSouth AsiaSouth Asia (IDA & IBRD)South SudanSpainSri LankaSt. Kitts and NevisSt. LuciaSt. Vincent and the GrenadinesSub-Saharan Africa Sub-Saharan Africa (excluding high income)Sub-Saharan Africa (IDA & IBRD countries)SudanSurinameSwazilandSwedenSwitzerlandSyrian Arab RepublicTajikistanTanzaniaThailandTimor-LesteTogoTongaTrinidad and TobagoTunisiaTurkeyTuvaluUgandaUkraineUnited KingdomUnited StatesUpper middle incomeUruguayVanuatuVenezuela, RBWest Bank and GazaWorldYemen, Rep.ZambiaZimbabwe Timeline:
This timeline shows a graph from 1978 to 2016 of Peru. No data until 1977. Number of actual observations by date: 39.
Source name:
World Development Indicators
Source organization:
International Monetary Fund, Balance of Payments Statistics Yearbook and data files.
Categories, topics:
Economy & Growth, Trade
Last updated:
apr 23, 2017
Indicators value changes by year
Minimum:
-0.986
jan 1, 1996
Maximum:
37.606
jan 1, 1985
At the date of observation
Value
Absolute change
Change from previous value
jan 1, 1978
25.561
+25.561
0.0%
jan 1, 1979
26.813
+1.253
4.9%
jan 1, 1980
23.817
-2.997
-11.18%
jan 1, 1981
24.895
+1.078
4.53%
jan 1, 1982
25.195
+0.3
1.2%
jan 1, 1983
27.041
+1.846
7.33%
jan 1, 1984
30.661
+3.62
13.39%
jan 1, 1985
37.606
+6.945
22.65%
jan 1, 1986
17.266
-20.34
-54.09%
jan 1, 1987
20.278
+3.012
17.45%
jan 1, 1988
16.434
-3.845
-18.96%
jan 1, 1989
16.381
-0.052
-0.32%
jan 1, 1990
18.683
+2.302
14.05%
jan 1, 1991
21.271
+2.588
13.85%
jan 1, 1992
24.654
+3.383
15.9%
jan 1, 1993
19.489
-5.165
-20.95%
jan 1, 1994
12.161
-7.329
-37.6%
jan 1, 1995
14.177
+2.017
16.58%
jan 1, 1996
-0.986
-15.163
-106.95%
jan 1, 1997
10.832
+11.818
-1.2K%
jan 1, 1998
5.901
-4.931
-45.52%
jan 1, 1999
-0.001
-5.903
-100.02%
jan 1, 2000
7.675
+7.676
-570.67K%
jan 1, 2001
3.706
-3.969
-51.72%
jan 1, 2002
1.401
-2.304
-62.19%
jan 1, 2003
2.765
+1.364
97.35%
jan 1, 2004
10.564
+7.798
282.0%
jan 1, 2005
10.087
-0.477
-4.51%
jan 1, 2006
6.639
-3.448
-34.18%
jan 1, 2007
2.074
-4.565
-68.76%
jan 1, 2008
4.759
+2.686
129.5%
jan 1, 2009
6.236
+1.477
31.03%
jan 1, 2010
10.138
+3.902
62.56%
jan 1, 2011
5.685
-4.453
-43.92%
jan 1, 2012
0.347
-5.338
-93.89%
jan 1, 2013
2.266
+1.919
552.53%
jan 1, 2014
3.183
+0.917
40.48%
jan 1, 2015
10.118
+6.934
217.82%
jan 1, 2016
7.612
-2.506
-24.77%
Ranking of countries by current statistics by years


Comments: