29
/
en
AIzaSyAYiBZKx7MnpbEhh9jyipgxe19OcubqV5w
April 1, 2024
228249
Romania
ROU
true
2
1
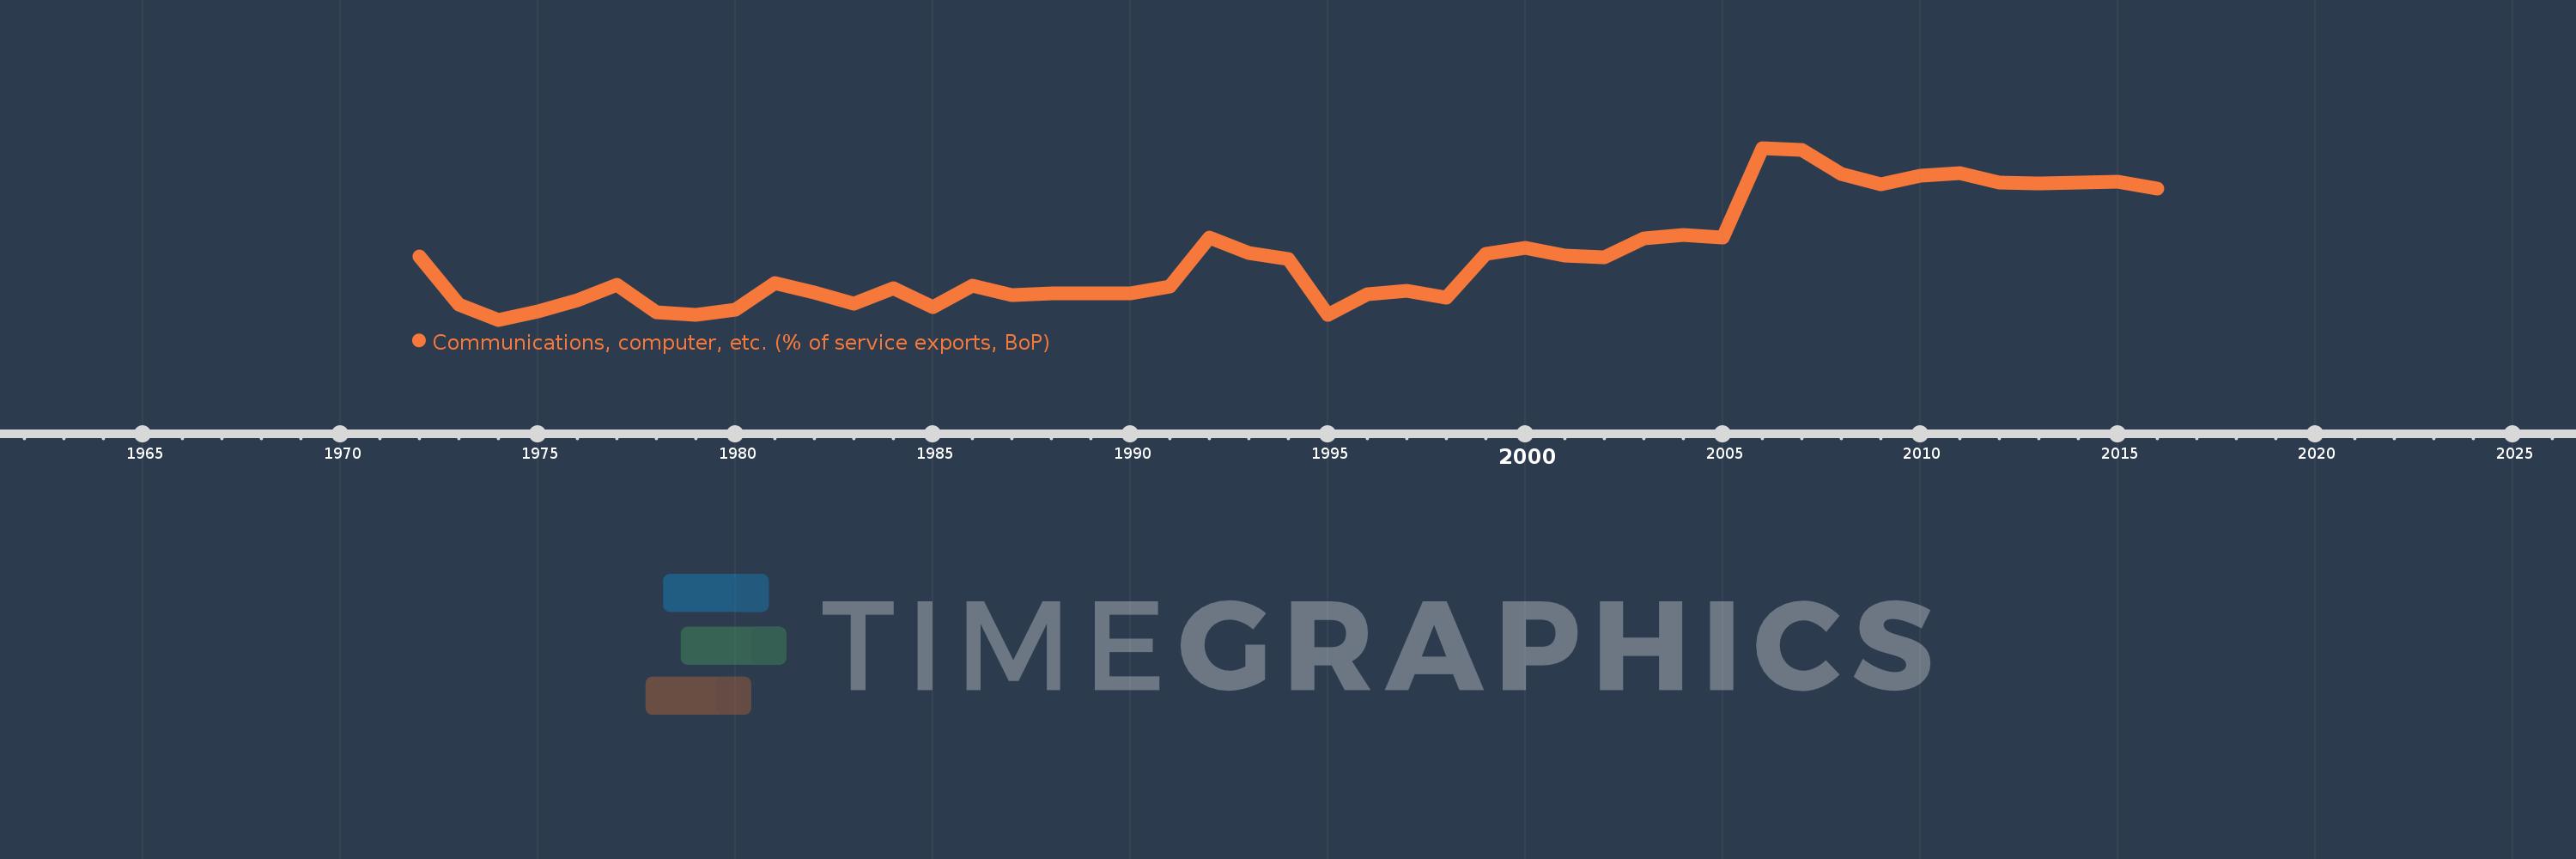
Communications, computer, etc. (% of service exports, BoP)
2016,2015,2014,2013,2012,2011,2010,2009,2008,2007,2006,2005,2004,2003,2002,2001,2000,1999,1998,1997,1996,1995,1994,1993,1992,1991,1990,1989,1988,1987,1986,1985,1984,1983,1982,1981,1980,1979,1978,1977,1976,1975,1974,1973,1972
This statistics in other country:
AfghanistanAlbaniaAlgeriaAngolaAntigua and BarbudaArab WorldArgentinaArmeniaArubaAustraliaAustriaAzerbaijanBahamas, TheBahrainBangladeshBarbadosBelarusBelgiumBelizeBeninBermudaBhutanBoliviaBosnia and HerzegovinaBotswanaBrazilBrunei DarussalamBulgariaBurkina FasoBurundiCabo VerdeCambodiaCameroonCanadaCaribbean small statesCentral African RepublicCentral Europe and the BalticsChadChileChinaColombiaComorosCongo, Dem. Rep.Congo, Rep.Costa RicaCote d'IvoireCroatiaCuracaoCyprusCzech RepublicDenmarkDjiboutiDominicaDominican RepublicEarly-demographic dividendEast Asia & PacificEast Asia & Pacific (excluding high income)East Asia & Pacific (IDA & IBRD countries)EcuadorEgypt, Arab Rep.El SalvadorEquatorial GuineaEritreaEstoniaEthiopiaEuro areaEurope & Central AsiaEurope & Central Asia (excluding high income)Europe & Central Asia (IDA & IBRD countries)European UnionFaroe IslandsFijiFinlandFragile and conflict affected situationsFranceFrench PolynesiaGabonGambia, TheGeorgiaGermanyGhanaGreeceGrenadaGuatemalaGuineaGuinea-BissauGuyanaHaitiHeavily indebted poor countries (HIPC)High incomeHondurasHong Kong SAR, ChinaHungaryIBRD onlyIcelandIDA & IBRD totalIDA onlyIDA totalIndiaIndonesiaIran, Islamic Rep.IraqIrelandIsraelItalyJamaicaJapanJordanKazakhstanKenyaKiribatiKorea, Rep.KosovoKuwaitKyrgyz RepublicLao PDRLate-demographic dividendLatin America & Caribbean Latin America & Caribbean (excluding high income)Latin America & the Caribbean (IDA & IBRD countries)LatviaLeast developed countries: UN classificationLebanonLesothoLiberiaLibyaLithuaniaLow & middle incomeLow incomeLower middle incomeLuxembourgMacao SAR, ChinaMacedonia, FYRMadagascarMalawiMalaysiaMaldivesMaliMaltaMarshall IslandsMauritaniaMauritiusMexicoMicronesia, Fed. Sts.Middle East & North AfricaMiddle East & North Africa (excluding high income)Middle East & North Africa (IDA & IBRD countries)Middle incomeMoldovaMongoliaMontenegroMoroccoMozambiqueMyanmarNamibiaNepalNetherlandsNew CaledoniaNew ZealandNicaraguaNigerNigeriaNorth AmericaNorwayOECD membersOmanOther small statesPacific island small statesPakistanPalauPanamaPapua New GuineaParaguayPeruPhilippinesPolandPortugalPost-demographic dividendPre-demographic dividendQatarRomaniaRussian FederationRwandaSamoaSao Tome and PrincipeSaudi ArabiaSenegalSerbiaSeychellesSierra LeoneSingaporeSint Maarten (Dutch part)Slovak RepublicSloveniaSmall statesSolomon IslandsSouth AfricaSouth AsiaSouth Asia (IDA & IBRD)South SudanSpainSri LankaSt. Kitts and NevisSt. LuciaSt. Vincent and the GrenadinesSub-Saharan Africa Sub-Saharan Africa (excluding high income)Sub-Saharan Africa (IDA & IBRD countries)SudanSurinameSwazilandSwedenSwitzerlandSyrian Arab RepublicTajikistanTanzaniaThailandTimor-LesteTogoTongaTrinidad and TobagoTunisiaTurkeyTuvaluUgandaUkraineUnited KingdomUnited StatesUpper middle incomeUruguayVanuatuVenezuela, RBWest Bank and GazaWorldYemen, Rep.ZambiaZimbabwe Timeline:
This timeline shows a graph from 1972 to 2016 of Romania. No data until 1971. Number of actual observations by date: 45.
Source name:
World Development Indicators
Source organization:
International Monetary Fund, Balance of Payments Statistics Yearbook and data files.
Categories, topics:
Economy & Growth, Trade
Last updated:
apr 23, 2017
Indicators value changes by year
Minimum:
15.976
jan 1, 1974
Maximum:
70.636
jan 1, 2006
At the date of observation
Value
Absolute change
Change from previous value
jan 1, 1972
36.071
+36.071
0.0%
jan 1, 1973
20.755
-15.317
-42.46%
jan 1, 1974
15.976
-4.778
-23.02%
jan 1, 1975
18.616
+2.639
16.52%
jan 1, 1976
22.293
+3.677
19.75%
jan 1, 1977
27.165
+4.872
21.86%
jan 1, 1978
18.474
-8.691
-31.99%
jan 1, 1979
17.422
-1.052
-5.69%
jan 1, 1980
19.277
+1.855
10.65%
jan 1, 1981
27.752
+8.475
43.96%
jan 1, 1982
24.566
-3.185
-11.48%
jan 1, 1983
21.212
-3.354
-13.65%
jan 1, 1984
26.135
+4.923
23.21%
jan 1, 1985
20.0
-6.135
-23.47%
jan 1, 1986
26.944
+6.944
34.72%
jan 1, 1987
23.789
-3.155
-11.71%
jan 1, 1988
24.286
+0.497
2.09%
jan 1, 1989
24.235
-0.05
-0.21%
jan 1, 1990
24.46
+0.225
0.93%
jan 1, 1991
26.557
+2.097
8.57%
jan 1, 1992
42.206
+15.649
58.92%
jan 1, 1993
37.329
-4.877
-11.55%
jan 1, 1994
35.294
-2.035
-5.45%
jan 1, 1995
17.636
-17.658
-50.03%
jan 1, 1996
24.085
+6.449
36.57%
jan 1, 1997
25.254
+1.169
4.85%
jan 1, 1998
22.942
-2.312
-9.16%
jan 1, 1999
36.862
+13.92
60.67%
jan 1, 2000
38.986
+2.124
5.76%
jan 1, 2001
36.322
-2.663
-6.83%
jan 1, 2002
35.86
-0.462
-1.27%
jan 1, 2003
41.826
+5.966
16.64%
jan 1, 2004
43.084
+1.259
3.01%
jan 1, 2005
42.223
-0.861
-2.0%
jan 1, 2006
70.636
+28.413
67.29%
jan 1, 2007
69.987
-0.649
-0.92%
jan 1, 2008
62.453
-7.533
-10.76%
jan 1, 2009
59.192
-3.262
-5.22%
jan 1, 2010
61.845
+2.653
4.48%
jan 1, 2011
62.615
+0.77
1.24%
jan 1, 2012
59.649
-2.966
-4.74%
jan 1, 2013
59.316
-0.333
-0.56%
jan 1, 2014
59.647
+0.331
0.56%
jan 1, 2015
59.773
+0.126
0.21%
jan 1, 2016
57.593
-2.18
-3.65%
Ranking of countries by current statistics by years


Comments: