29
/
en
AIzaSyAYiBZKx7MnpbEhh9jyipgxe19OcubqV5w
April 1, 2024
201356
Morocco
MAR
true
2
1
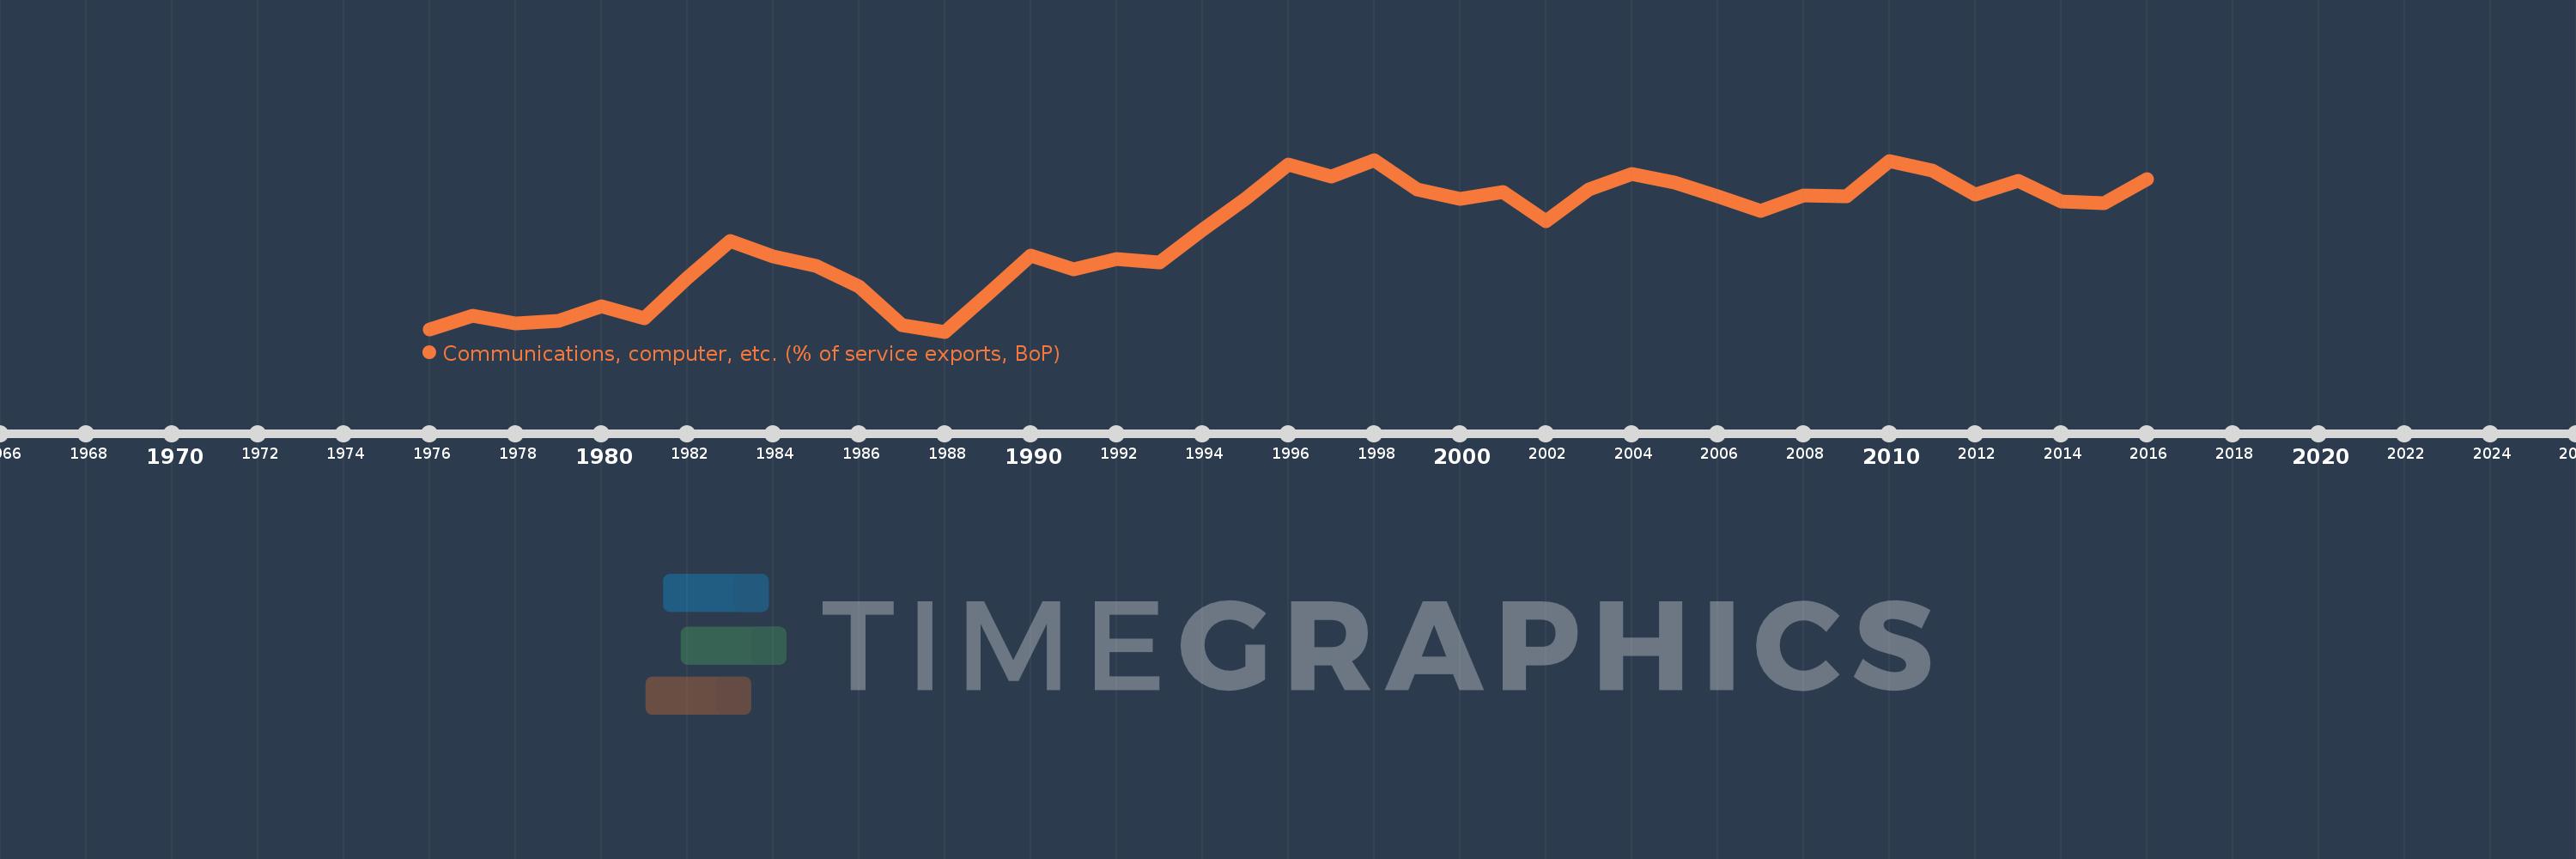
Communications, computer, etc. (% of service exports, BoP)
2016,2015,2014,2013,2012,2011,2010,2009,2008,2007,2006,2005,2004,2003,2002,2001,2000,1999,1998,1997,1996,1995,1994,1993,1992,1991,1990,1989,1988,1987,1986,1985,1984,1983,1982,1981,1980,1979,1978,1977,1976
This statistics in other country:
AfghanistanAlbaniaAlgeriaAngolaAntigua and BarbudaArab WorldArgentinaArmeniaArubaAustraliaAustriaAzerbaijanBahamas, TheBahrainBangladeshBarbadosBelarusBelgiumBelizeBeninBermudaBhutanBoliviaBosnia and HerzegovinaBotswanaBrazilBrunei DarussalamBulgariaBurkina FasoBurundiCabo VerdeCambodiaCameroonCanadaCaribbean small statesCentral African RepublicCentral Europe and the BalticsChadChileChinaColombiaComorosCongo, Dem. Rep.Congo, Rep.Costa RicaCote d'IvoireCroatiaCuracaoCyprusCzech RepublicDenmarkDjiboutiDominicaDominican RepublicEarly-demographic dividendEast Asia & PacificEast Asia & Pacific (excluding high income)East Asia & Pacific (IDA & IBRD countries)EcuadorEgypt, Arab Rep.El SalvadorEquatorial GuineaEritreaEstoniaEthiopiaEuro areaEurope & Central AsiaEurope & Central Asia (excluding high income)Europe & Central Asia (IDA & IBRD countries)European UnionFaroe IslandsFijiFinlandFragile and conflict affected situationsFranceFrench PolynesiaGabonGambia, TheGeorgiaGermanyGhanaGreeceGrenadaGuatemalaGuineaGuinea-BissauGuyanaHaitiHeavily indebted poor countries (HIPC)High incomeHondurasHong Kong SAR, ChinaHungaryIBRD onlyIcelandIDA & IBRD totalIDA onlyIDA totalIndiaIndonesiaIran, Islamic Rep.IraqIrelandIsraelItalyJamaicaJapanJordanKazakhstanKenyaKiribatiKorea, Rep.KosovoKuwaitKyrgyz RepublicLao PDRLate-demographic dividendLatin America & Caribbean Latin America & Caribbean (excluding high income)Latin America & the Caribbean (IDA & IBRD countries)LatviaLeast developed countries: UN classificationLebanonLesothoLiberiaLibyaLithuaniaLow & middle incomeLow incomeLower middle incomeLuxembourgMacao SAR, ChinaMacedonia, FYRMadagascarMalawiMalaysiaMaldivesMaliMaltaMarshall IslandsMauritaniaMauritiusMexicoMicronesia, Fed. Sts.Middle East & North AfricaMiddle East & North Africa (excluding high income)Middle East & North Africa (IDA & IBRD countries)Middle incomeMoldovaMongoliaMontenegroMoroccoMozambiqueMyanmarNamibiaNepalNetherlandsNew CaledoniaNew ZealandNicaraguaNigerNigeriaNorth AmericaNorwayOECD membersOmanOther small statesPacific island small statesPakistanPalauPanamaPapua New GuineaParaguayPeruPhilippinesPolandPortugalPost-demographic dividendPre-demographic dividendQatarRomaniaRussian FederationRwandaSamoaSao Tome and PrincipeSaudi ArabiaSenegalSerbiaSeychellesSierra LeoneSingaporeSint Maarten (Dutch part)Slovak RepublicSloveniaSmall statesSolomon IslandsSouth AfricaSouth AsiaSouth Asia (IDA & IBRD)South SudanSpainSri LankaSt. Kitts and NevisSt. LuciaSt. Vincent and the GrenadinesSub-Saharan Africa Sub-Saharan Africa (excluding high income)Sub-Saharan Africa (IDA & IBRD countries)SudanSurinameSwazilandSwedenSwitzerlandSyrian Arab RepublicTajikistanTanzaniaThailandTimor-LesteTogoTongaTrinidad and TobagoTunisiaTurkeyTuvaluUgandaUkraineUnited KingdomUnited StatesUpper middle incomeUruguayVanuatuVenezuela, RBWest Bank and GazaWorldYemen, Rep.ZambiaZimbabwe Timeline:
This timeline shows a graph from 1976 to 2016 of Morocco. No data until 1975. Number of actual observations by date: 41.
Source name:
World Development Indicators
Source organization:
International Monetary Fund, Balance of Payments Statistics Yearbook and data files.
Categories, topics:
Economy & Growth, Trade
Last updated:
apr 23, 2017
Indicators value changes by year
Maximum:
39.835
jan 1, 1998
At the date of observation
Value
Absolute change
Change from previous value
jan 1, 1976
19.402
+19.402
0.0%
jan 1, 1977
21.064
+1.662
8.57%
jan 1, 1978
20.071
-0.992
-4.71%
jan 1, 1979
20.428
+0.357
1.78%
jan 1, 1980
22.133
+1.706
8.35%
jan 1, 1981
20.673
-1.461
-6.6%
jan 1, 1982
25.585
+4.912
23.76%
jan 1, 1983
30.022
+4.436
17.34%
jan 1, 1984
28.198
-1.823
-6.07%
jan 1, 1985
27.058
-1.141
-4.05%
jan 1, 1986
24.501
-2.557
-9.45%
jan 1, 1987
19.866
-4.635
-18.92%
jan 1, 1988
19.11
-0.756
-3.8%
jan 1, 1989
23.624
+4.514
23.62%
jan 1, 1990
28.262
+4.638
19.63%
jan 1, 1991
26.615
-1.647
-5.83%
jan 1, 1992
27.847
+1.232
4.63%
jan 1, 1993
27.447
-0.4
-1.44%
jan 1, 1994
31.399
+3.952
14.4%
jan 1, 1995
35.099
+3.701
11.79%
jan 1, 1996
39.238
+4.139
11.79%
jan 1, 1997
37.837
-1.401
-3.57%
jan 1, 1998
39.835
+1.997
5.28%
jan 1, 1999
36.27
-3.565
-8.95%
jan 1, 2000
35.086
-1.183
-3.26%
jan 1, 2001
35.996
+0.909
2.59%
jan 1, 2002
32.447
-3.549
-9.86%
jan 1, 2003
36.31
+3.864
11.91%
jan 1, 2004
38.168
+1.858
5.12%
jan 1, 2005
37.086
-1.082
-2.83%
jan 1, 2006
35.428
-1.658
-4.47%
jan 1, 2007
33.65
-1.778
-5.02%
jan 1, 2008
35.508
+1.858
5.52%
jan 1, 2009
35.421
-0.087
-0.25%
jan 1, 2010
39.678
+4.257
12.02%
jan 1, 2011
38.582
-1.096
-2.76%
jan 1, 2012
35.621
-2.961
-7.67%
jan 1, 2013
37.25
+1.629
4.57%
jan 1, 2014
34.833
-2.417
-6.49%
jan 1, 2015
34.647
-0.185
-0.53%
jan 1, 2016
37.552
+2.905
8.38%
Ranking of countries by current statistics by years


Comments: