29
/
en
AIzaSyAYiBZKx7MnpbEhh9jyipgxe19OcubqV5w
April 1, 2024
141623
Greece
GRC
true
2
1
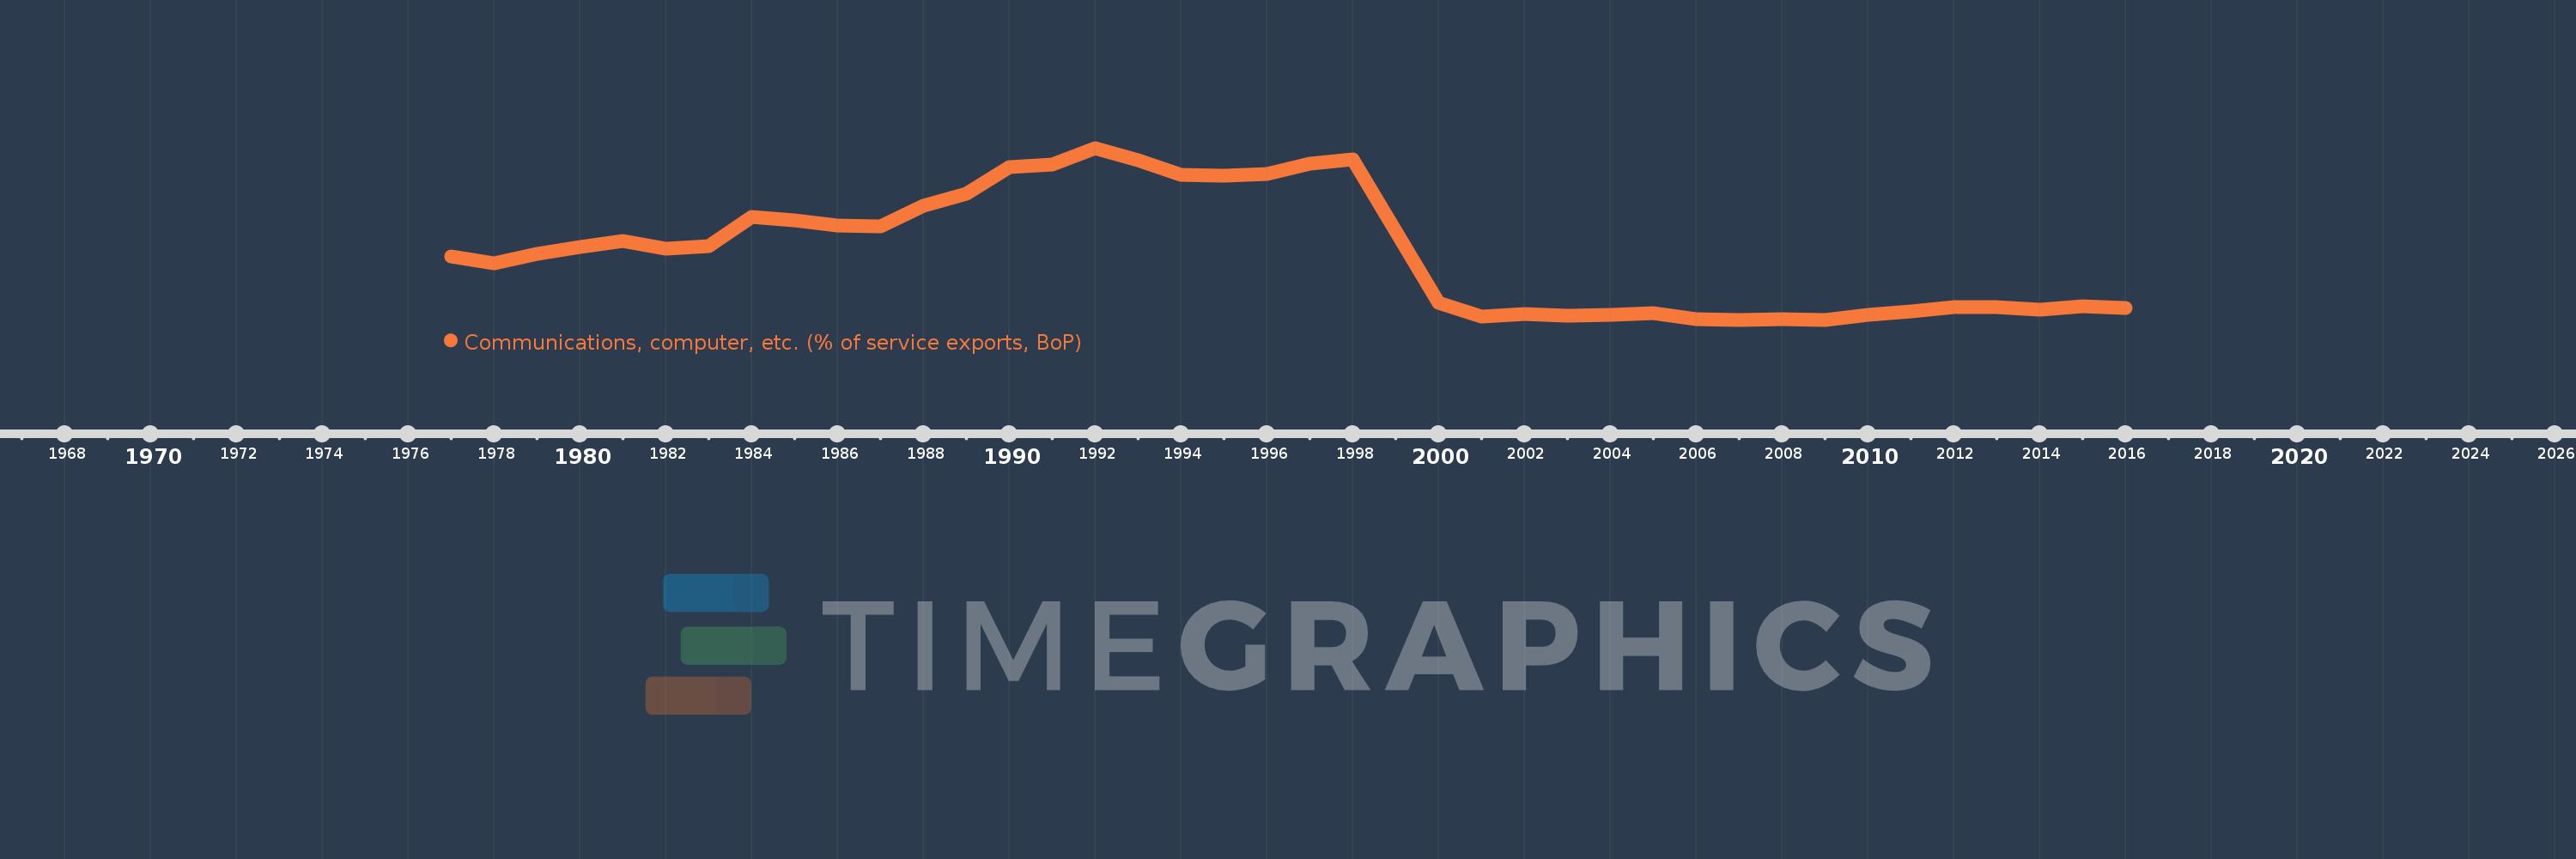
Communications, computer, etc. (% of service exports, BoP)
2016,2015,2014,2013,2012,2011,2010,2009,2008,2007,2006,2005,2004,2003,2002,2001,2000,1998,1997,1996,1995,1994,1993,1992,1991,1990,1989,1988,1987,1986,1985,1984,1983,1982,1981,1980,1979,1978,1977
This statistics in other country:
AfghanistanAlbaniaAlgeriaAngolaAntigua and BarbudaArab WorldArgentinaArmeniaArubaAustraliaAustriaAzerbaijanBahamas, TheBahrainBangladeshBarbadosBelarusBelgiumBelizeBeninBermudaBhutanBoliviaBosnia and HerzegovinaBotswanaBrazilBrunei DarussalamBulgariaBurkina FasoBurundiCabo VerdeCambodiaCameroonCanadaCaribbean small statesCentral African RepublicCentral Europe and the BalticsChadChileChinaColombiaComorosCongo, Dem. Rep.Congo, Rep.Costa RicaCote d'IvoireCroatiaCuracaoCyprusCzech RepublicDenmarkDjiboutiDominicaDominican RepublicEarly-demographic dividendEast Asia & PacificEast Asia & Pacific (excluding high income)East Asia & Pacific (IDA & IBRD countries)EcuadorEgypt, Arab Rep.El SalvadorEquatorial GuineaEritreaEstoniaEthiopiaEuro areaEurope & Central AsiaEurope & Central Asia (excluding high income)Europe & Central Asia (IDA & IBRD countries)European UnionFaroe IslandsFijiFinlandFragile and conflict affected situationsFranceFrench PolynesiaGabonGambia, TheGeorgiaGermanyGhanaGreeceGrenadaGuatemalaGuineaGuinea-BissauGuyanaHaitiHeavily indebted poor countries (HIPC)High incomeHondurasHong Kong SAR, ChinaHungaryIBRD onlyIcelandIDA & IBRD totalIDA onlyIDA totalIndiaIndonesiaIran, Islamic Rep.IraqIrelandIsraelItalyJamaicaJapanJordanKazakhstanKenyaKiribatiKorea, Rep.KosovoKuwaitKyrgyz RepublicLao PDRLate-demographic dividendLatin America & Caribbean Latin America & Caribbean (excluding high income)Latin America & the Caribbean (IDA & IBRD countries)LatviaLeast developed countries: UN classificationLebanonLesothoLiberiaLibyaLithuaniaLow & middle incomeLow incomeLower middle incomeLuxembourgMacao SAR, ChinaMacedonia, FYRMadagascarMalawiMalaysiaMaldivesMaliMaltaMarshall IslandsMauritaniaMauritiusMexicoMicronesia, Fed. Sts.Middle East & North AfricaMiddle East & North Africa (excluding high income)Middle East & North Africa (IDA & IBRD countries)Middle incomeMoldovaMongoliaMontenegroMoroccoMozambiqueMyanmarNamibiaNepalNetherlandsNew CaledoniaNew ZealandNicaraguaNigerNigeriaNorth AmericaNorwayOECD membersOmanOther small statesPacific island small statesPakistanPalauPanamaPapua New GuineaParaguayPeruPhilippinesPolandPortugalPost-demographic dividendPre-demographic dividendQatarRomaniaRussian FederationRwandaSamoaSao Tome and PrincipeSaudi ArabiaSenegalSerbiaSeychellesSierra LeoneSingaporeSint Maarten (Dutch part)Slovak RepublicSloveniaSmall statesSolomon IslandsSouth AfricaSouth AsiaSouth Asia (IDA & IBRD)South SudanSpainSri LankaSt. Kitts and NevisSt. LuciaSt. Vincent and the GrenadinesSub-Saharan Africa Sub-Saharan Africa (excluding high income)Sub-Saharan Africa (IDA & IBRD countries)SudanSurinameSwazilandSwedenSwitzerlandSyrian Arab RepublicTajikistanTanzaniaThailandTimor-LesteTogoTongaTrinidad and TobagoTunisiaTurkeyTuvaluUgandaUkraineUnited KingdomUnited StatesUpper middle incomeUruguayVanuatuVenezuela, RBWest Bank and GazaWorldYemen, Rep.ZambiaZimbabwe Timeline:
This timeline shows a graph from 1977 to 2016 of Greece. No data until 1976. Number of actual observations by date: 39.
Source name:
World Development Indicators
Source organization:
International Monetary Fund, Balance of Payments Statistics Yearbook and data files.
Categories, topics:
Economy & Growth, Trade
Last updated:
apr 23, 2017
Indicators value changes by year
Maximum:
60.673
jan 1, 1992
At the date of observation
Value
Absolute change
Change from previous value
jan 1, 1977
27.71
+27.71
0.0%
jan 1, 1978
25.785
-1.925
-6.95%
jan 1, 1979
28.503
+2.717
10.54%
jan 1, 1980
30.675
+2.172
7.62%
jan 1, 1981
32.354
+1.678
5.47%
jan 1, 1982
30.053
-2.301
-7.11%
jan 1, 1983
30.923
+0.869
2.89%
jan 1, 1984
39.797
+8.874
28.7%
jan 1, 1985
38.84
-0.957
-2.4%
jan 1, 1986
37.115
-1.725
-4.44%
jan 1, 1987
36.819
-0.296
-0.8%
jan 1, 1988
43.121
+6.302
17.12%
jan 1, 1989
46.859
+3.738
8.67%
jan 1, 1990
54.785
+7.926
16.91%
jan 1, 1991
55.549
+0.764
1.39%
jan 1, 1992
60.673
+5.124
9.22%
jan 1, 1993
56.87
-3.803
-6.27%
jan 1, 1994
52.496
-4.374
-7.69%
jan 1, 1995
52.372
-0.124
-0.24%
jan 1, 1996
52.785
+0.413
0.79%
jan 1, 1997
55.852
+3.067
5.81%
jan 1, 1998
57.198
+1.347
2.41%
jan 1, 2000
13.854
-43.345
-75.78%
jan 1, 2001
9.613
-4.241
-30.61%
jan 1, 2002
10.337
+0.725
7.54%
jan 1, 2003
9.908
-0.43
-4.16%
jan 1, 2004
9.986
+0.078
0.79%
jan 1, 2005
10.708
+0.722
7.23%
jan 1, 2006
8.841
-1.867
-17.44%
jan 1, 2007
8.597
-0.243
-2.75%
jan 1, 2008
8.841
+0.244
2.84%
jan 1, 2009
8.608
-0.233
-2.64%
jan 1, 2010
10.12
+1.511
17.56%
jan 1, 2011
11.128
+1.008
9.96%
jan 1, 2012
12.387
+1.26
11.32%
jan 1, 2013
12.328
-0.059
-0.48%
jan 1, 2014
11.673
-0.656
-5.32%
jan 1, 2015
12.76
+1.088
9.32%
jan 1, 2016
12.252
-0.508
-3.98%
Ranking of countries by current statistics by years


Comments: