29
/
en
AIzaSyAYiBZKx7MnpbEhh9jyipgxe19OcubqV5w
April 1, 2024
142802
Grenada
GRD
true
2
1
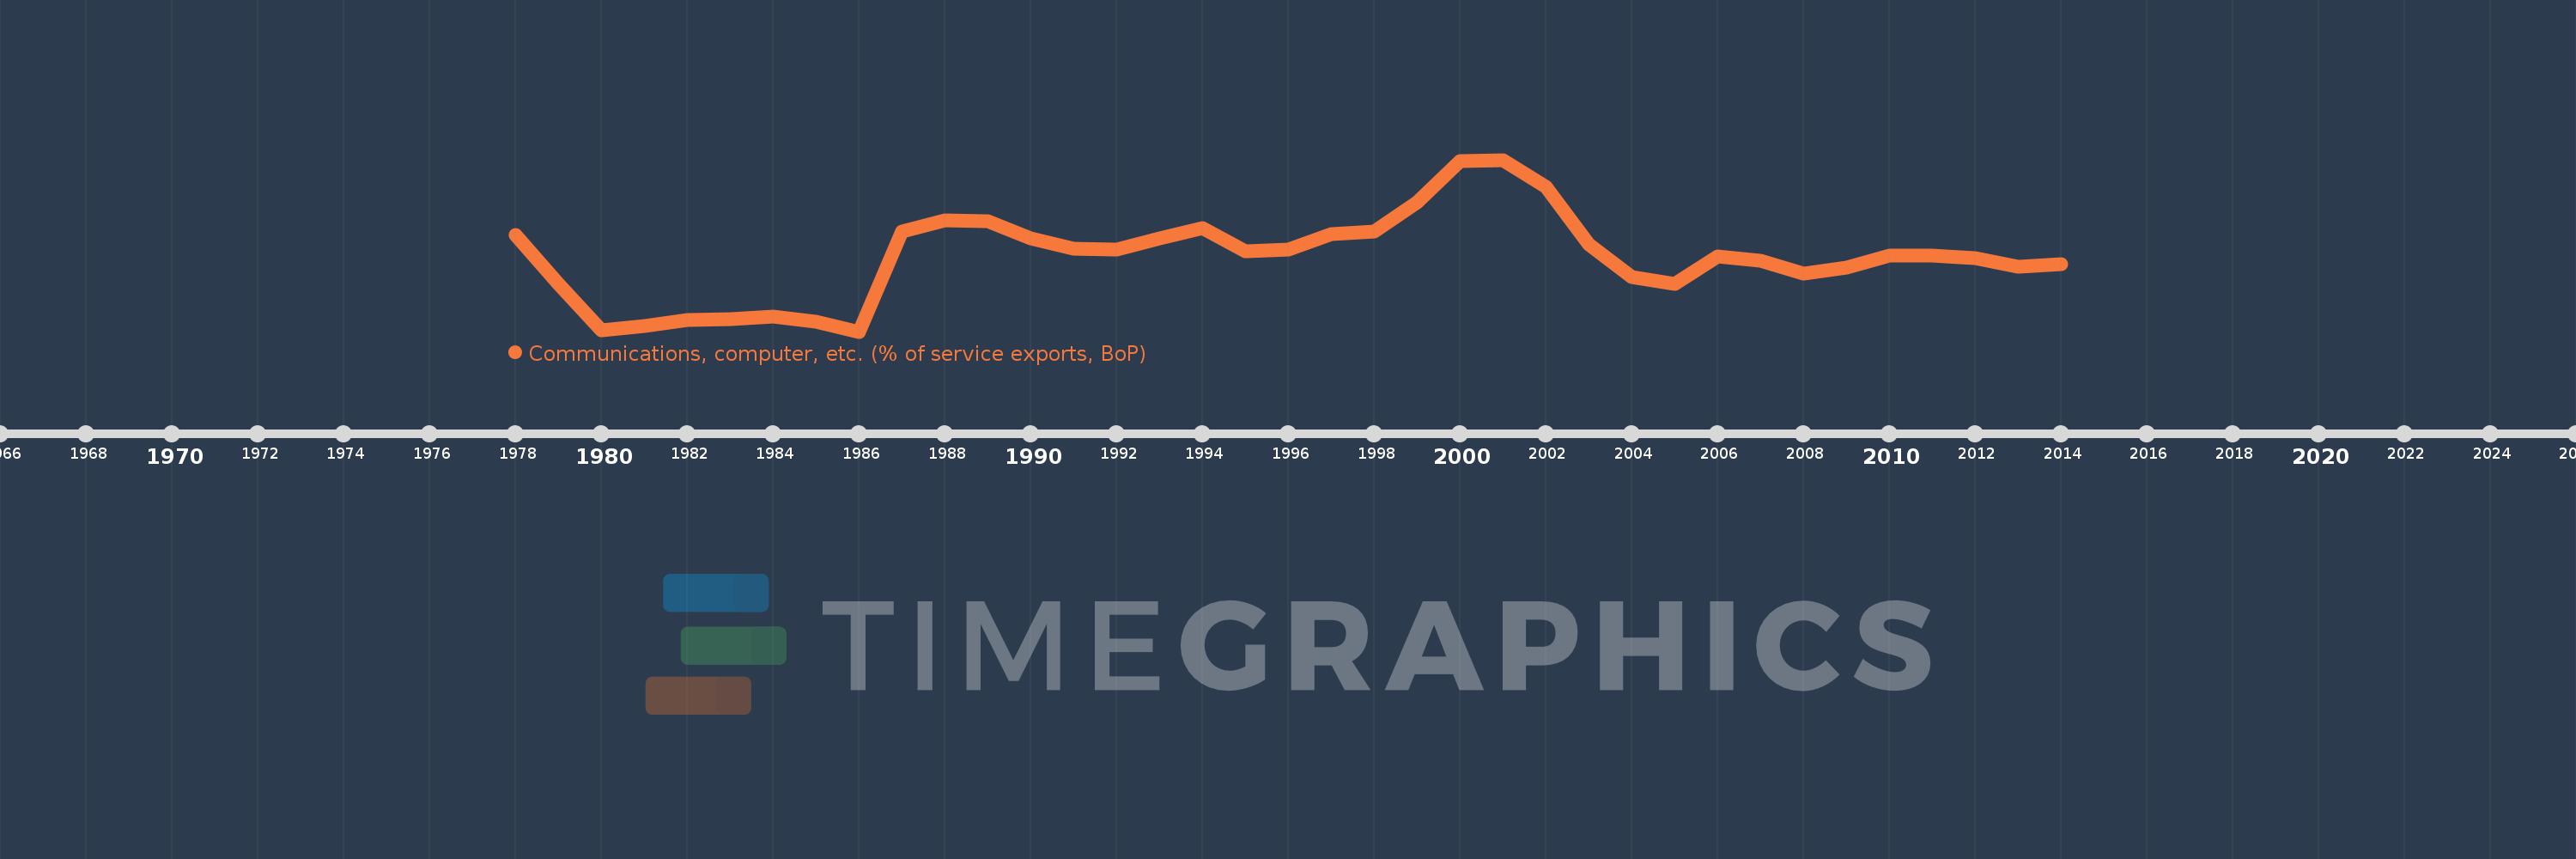
Communications, computer, etc. (% of service exports, BoP)
2014,2013,2012,2011,2010,2009,2008,2007,2006,2005,2004,2003,2002,2001,2000,1999,1998,1997,1996,1995,1994,1993,1992,1991,1990,1989,1988,1987,1986,1985,1984,1983,1982,1981,1980,1979,1978
This statistics in other country:
AfghanistanAlbaniaAlgeriaAngolaAntigua and BarbudaArab WorldArgentinaArmeniaArubaAustraliaAustriaAzerbaijanBahamas, TheBahrainBangladeshBarbadosBelarusBelgiumBelizeBeninBermudaBhutanBoliviaBosnia and HerzegovinaBotswanaBrazilBrunei DarussalamBulgariaBurkina FasoBurundiCabo VerdeCambodiaCameroonCanadaCaribbean small statesCentral African RepublicCentral Europe and the BalticsChadChileChinaColombiaComorosCongo, Dem. Rep.Congo, Rep.Costa RicaCote d'IvoireCroatiaCuracaoCyprusCzech RepublicDenmarkDjiboutiDominicaDominican RepublicEarly-demographic dividendEast Asia & PacificEast Asia & Pacific (excluding high income)East Asia & Pacific (IDA & IBRD countries)EcuadorEgypt, Arab Rep.El SalvadorEquatorial GuineaEritreaEstoniaEthiopiaEuro areaEurope & Central AsiaEurope & Central Asia (excluding high income)Europe & Central Asia (IDA & IBRD countries)European UnionFaroe IslandsFijiFinlandFragile and conflict affected situationsFranceFrench PolynesiaGabonGambia, TheGeorgiaGermanyGhanaGreeceGrenadaGuatemalaGuineaGuinea-BissauGuyanaHaitiHeavily indebted poor countries (HIPC)High incomeHondurasHong Kong SAR, ChinaHungaryIBRD onlyIcelandIDA & IBRD totalIDA onlyIDA totalIndiaIndonesiaIran, Islamic Rep.IraqIrelandIsraelItalyJamaicaJapanJordanKazakhstanKenyaKiribatiKorea, Rep.KosovoKuwaitKyrgyz RepublicLao PDRLate-demographic dividendLatin America & Caribbean Latin America & Caribbean (excluding high income)Latin America & the Caribbean (IDA & IBRD countries)LatviaLeast developed countries: UN classificationLebanonLesothoLiberiaLibyaLithuaniaLow & middle incomeLow incomeLower middle incomeLuxembourgMacao SAR, ChinaMacedonia, FYRMadagascarMalawiMalaysiaMaldivesMaliMaltaMarshall IslandsMauritaniaMauritiusMexicoMicronesia, Fed. Sts.Middle East & North AfricaMiddle East & North Africa (excluding high income)Middle East & North Africa (IDA & IBRD countries)Middle incomeMoldovaMongoliaMontenegroMoroccoMozambiqueMyanmarNamibiaNepalNetherlandsNew CaledoniaNew ZealandNicaraguaNigerNigeriaNorth AmericaNorwayOECD membersOmanOther small statesPacific island small statesPakistanPalauPanamaPapua New GuineaParaguayPeruPhilippinesPolandPortugalPost-demographic dividendPre-demographic dividendQatarRomaniaRussian FederationRwandaSamoaSao Tome and PrincipeSaudi ArabiaSenegalSerbiaSeychellesSierra LeoneSingaporeSint Maarten (Dutch part)Slovak RepublicSloveniaSmall statesSolomon IslandsSouth AfricaSouth AsiaSouth Asia (IDA & IBRD)South SudanSpainSri LankaSt. Kitts and NevisSt. LuciaSt. Vincent and the GrenadinesSub-Saharan Africa Sub-Saharan Africa (excluding high income)Sub-Saharan Africa (IDA & IBRD countries)SudanSurinameSwazilandSwedenSwitzerlandSyrian Arab RepublicTajikistanTanzaniaThailandTimor-LesteTogoTongaTrinidad and TobagoTunisiaTurkeyTuvaluUgandaUkraineUnited KingdomUnited StatesUpper middle incomeUruguayVanuatuVenezuela, RBWest Bank and GazaWorldYemen, Rep.ZambiaZimbabwe Timeline:
This timeline shows a graph from 1978 to 2014 of Grenada. No data until 1977. Number of actual observations by date: 37.
Source name:
World Development Indicators
Source organization:
International Monetary Fund, Balance of Payments Statistics Yearbook and data files.
Categories, topics:
Economy & Growth, Trade
Last updated:
apr 23, 2017
Indicators value changes by year
Maximum:
33.557
jan 1, 2001
At the date of observation
Value
Absolute change
Change from previous value
jan 1, 1978
20.548
+20.548
0.0%
jan 1, 1979
12.195
-8.353
-40.65%
jan 1, 1980
4.177
-8.018
-65.75%
jan 1, 1981
4.854
+0.677
16.21%
jan 1, 1982
5.882
+1.028
21.18%
jan 1, 1983
6.011
+0.129
2.19%
jan 1, 1984
6.452
+0.441
7.33%
jan 1, 1985
5.556
-0.896
-13.89%
jan 1, 1986
3.923
-1.633
-29.39%
jan 1, 1987
21.251
+17.328
441.77%
jan 1, 1988
23.149
+1.898
8.93%
jan 1, 1989
22.991
-0.158
-0.68%
jan 1, 1990
19.945
-3.046
-13.25%
jan 1, 1991
18.162
-1.783
-8.94%
jan 1, 1992
18.008
-0.154
-0.85%
jan 1, 1993
20.07
+2.062
11.45%
jan 1, 1994
21.744
+1.674
8.34%
jan 1, 1995
17.821
-3.924
-18.05%
jan 1, 1996
18.072
+0.251
1.41%
jan 1, 1997
20.798
+2.726
15.08%
jan 1, 1998
21.181
+0.383
1.84%
jan 1, 1999
26.223
+5.042
23.81%
jan 1, 2000
33.39
+7.167
27.33%
jan 1, 2001
33.557
+0.167
0.5%
jan 1, 2002
28.875
-4.682
-13.95%
jan 1, 2003
18.912
-9.963
-34.5%
jan 1, 2004
13.311
-5.601
-29.62%
jan 1, 2005
12.157
-1.154
-8.67%
jan 1, 2006
16.952
+4.795
39.44%
jan 1, 2007
16.168
-0.784
-4.63%
jan 1, 2008
13.994
-2.174
-13.45%
jan 1, 2009
14.908
+0.914
6.53%
jan 1, 2010
17.101
+2.193
14.71%
jan 1, 2011
17.098
-0.003
-0.02%
jan 1, 2012
16.62
-0.478
-2.8%
jan 1, 2013
15.042
-1.578
-9.49%
jan 1, 2014
15.484
+0.442
2.94%
Ranking of countries by current statistics by years


Comments: