29
/
en
AIzaSyAYiBZKx7MnpbEhh9jyipgxe19OcubqV5w
April 1, 2024
130221
Ethiopia
ETH
true
2
1
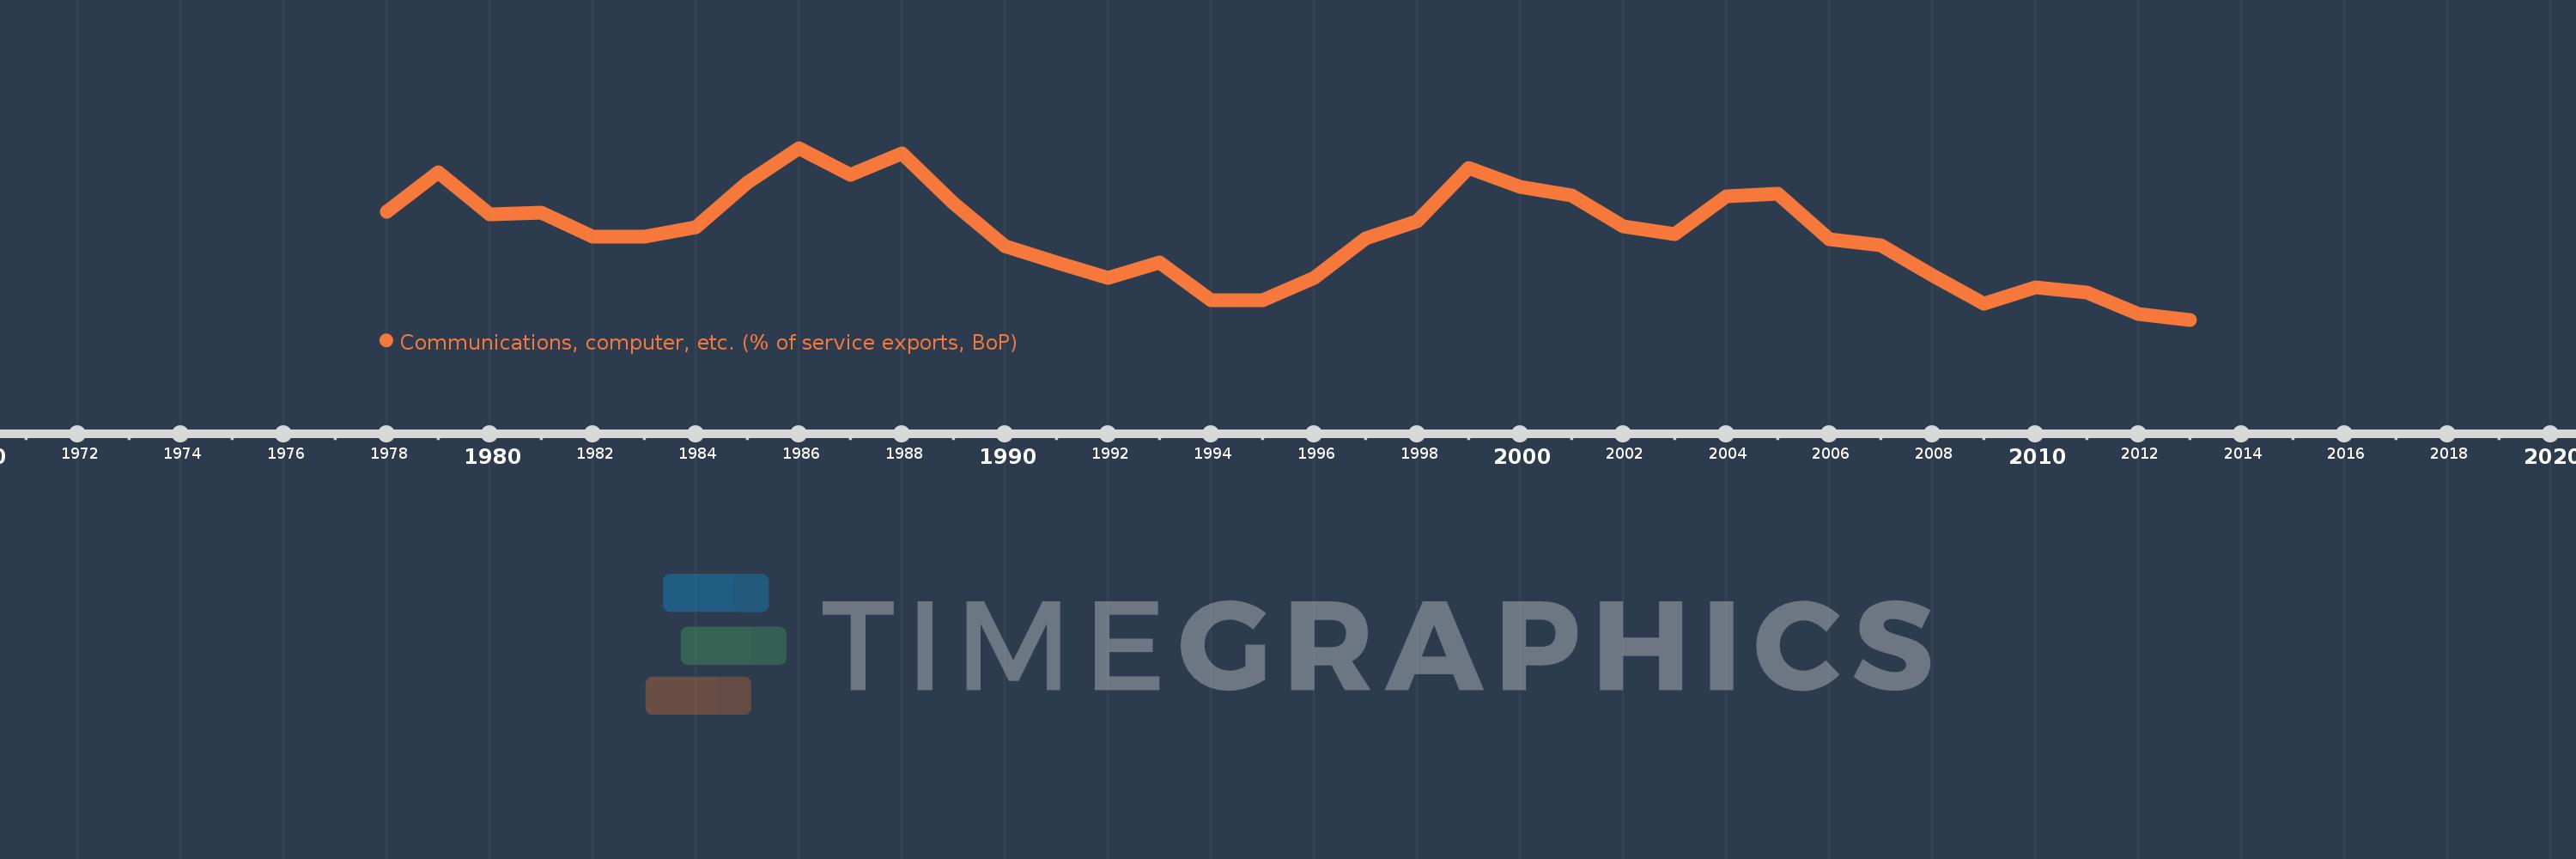
Communications, computer, etc. (% of service exports, BoP)
2013,2012,2011,2010,2009,2008,2007,2006,2005,2004,2003,2002,2001,2000,1999,1998,1997,1996,1995,1994,1993,1992,1991,1990,1989,1988,1987,1986,1985,1984,1983,1982,1981,1980,1979,1978
This statistics in other country:
AfghanistanAlbaniaAlgeriaAngolaAntigua and BarbudaArab WorldArgentinaArmeniaArubaAustraliaAustriaAzerbaijanBahamas, TheBahrainBangladeshBarbadosBelarusBelgiumBelizeBeninBermudaBhutanBoliviaBosnia and HerzegovinaBotswanaBrazilBrunei DarussalamBulgariaBurkina FasoBurundiCabo VerdeCambodiaCameroonCanadaCaribbean small statesCentral African RepublicCentral Europe and the BalticsChadChileChinaColombiaComorosCongo, Dem. Rep.Congo, Rep.Costa RicaCote d'IvoireCroatiaCuracaoCyprusCzech RepublicDenmarkDjiboutiDominicaDominican RepublicEarly-demographic dividendEast Asia & PacificEast Asia & Pacific (excluding high income)East Asia & Pacific (IDA & IBRD countries)EcuadorEgypt, Arab Rep.El SalvadorEquatorial GuineaEritreaEstoniaEthiopiaEuro areaEurope & Central AsiaEurope & Central Asia (excluding high income)Europe & Central Asia (IDA & IBRD countries)European UnionFaroe IslandsFijiFinlandFragile and conflict affected situationsFranceFrench PolynesiaGabonGambia, TheGeorgiaGermanyGhanaGreeceGrenadaGuatemalaGuineaGuinea-BissauGuyanaHaitiHeavily indebted poor countries (HIPC)High incomeHondurasHong Kong SAR, ChinaHungaryIBRD onlyIcelandIDA & IBRD totalIDA onlyIDA totalIndiaIndonesiaIran, Islamic Rep.IraqIrelandIsraelItalyJamaicaJapanJordanKazakhstanKenyaKiribatiKorea, Rep.KosovoKuwaitKyrgyz RepublicLao PDRLate-demographic dividendLatin America & Caribbean Latin America & Caribbean (excluding high income)Latin America & the Caribbean (IDA & IBRD countries)LatviaLeast developed countries: UN classificationLebanonLesothoLiberiaLibyaLithuaniaLow & middle incomeLow incomeLower middle incomeLuxembourgMacao SAR, ChinaMacedonia, FYRMadagascarMalawiMalaysiaMaldivesMaliMaltaMarshall IslandsMauritaniaMauritiusMexicoMicronesia, Fed. Sts.Middle East & North AfricaMiddle East & North Africa (excluding high income)Middle East & North Africa (IDA & IBRD countries)Middle incomeMoldovaMongoliaMontenegroMoroccoMozambiqueMyanmarNamibiaNepalNetherlandsNew CaledoniaNew ZealandNicaraguaNigerNigeriaNorth AmericaNorwayOECD membersOmanOther small statesPacific island small statesPakistanPalauPanamaPapua New GuineaParaguayPeruPhilippinesPolandPortugalPost-demographic dividendPre-demographic dividendQatarRomaniaRussian FederationRwandaSamoaSao Tome and PrincipeSaudi ArabiaSenegalSerbiaSeychellesSierra LeoneSingaporeSint Maarten (Dutch part)Slovak RepublicSloveniaSmall statesSolomon IslandsSouth AfricaSouth AsiaSouth Asia (IDA & IBRD)South SudanSpainSri LankaSt. Kitts and NevisSt. LuciaSt. Vincent and the GrenadinesSub-Saharan Africa Sub-Saharan Africa (excluding high income)Sub-Saharan Africa (IDA & IBRD countries)SudanSurinameSwazilandSwedenSwitzerlandSyrian Arab RepublicTajikistanTanzaniaThailandTimor-LesteTogoTongaTrinidad and TobagoTunisiaTurkeyTuvaluUgandaUkraineUnited KingdomUnited StatesUpper middle incomeUruguayVanuatuVenezuela, RBWest Bank and GazaWorldYemen, Rep.ZambiaZimbabwe Timeline:
This timeline shows a graph from 1978 to 2013 of Ethiopia. No data until 1977. Number of actual observations by date: 36.
Source name:
World Development Indicators
Source organization:
International Monetary Fund, Balance of Payments Statistics Yearbook and data files.
Categories, topics:
Economy & Growth, Trade
Last updated:
apr 23, 2017
Indicators value changes by year
Minimum:
14.544
jan 1, 2013
Maximum:
56.732
jan 1, 1986
At the date of observation
Value
Absolute change
Change from previous value
jan 1, 1978
41.048
+41.048
0.0%
jan 1, 1979
50.699
+9.651
23.51%
jan 1, 1980
40.347
-10.352
-20.42%
jan 1, 1981
40.871
+0.524
1.3%
jan 1, 1982
34.891
-5.98
-14.63%
jan 1, 1983
34.966
+0.076
0.22%
jan 1, 1984
37.239
+2.273
6.5%
jan 1, 1985
48.161
+10.921
29.33%
jan 1, 1986
56.732
+8.571
17.8%
jan 1, 1987
50.03
-6.702
-11.81%
jan 1, 1988
55.395
+5.365
10.72%
jan 1, 1989
43.236
-12.159
-21.95%
jan 1, 1990
32.559
-10.676
-24.69%
jan 1, 1991
28.639
-3.92
-12.04%
jan 1, 1992
24.905
-3.734
-13.04%
jan 1, 1993
28.685
+3.78
15.18%
jan 1, 1994
19.276
-9.41
-32.8%
jan 1, 1995
19.395
+0.119
0.62%
jan 1, 1996
24.836
+5.441
28.05%
jan 1, 1997
34.62
+9.784
39.39%
jan 1, 1998
38.765
+4.145
11.97%
jan 1, 1999
51.813
+13.048
33.66%
jan 1, 2000
47.167
-4.646
-8.97%
jan 1, 2001
45.148
-2.019
-4.28%
jan 1, 2002
37.53
-7.618
-16.87%
jan 1, 2003
35.636
-1.894
-5.05%
jan 1, 2004
44.961
+9.325
26.17%
jan 1, 2005
45.486
+0.524
1.17%
jan 1, 2006
34.212
-11.274
-24.78%
jan 1, 2007
32.906
-1.306
-3.82%
jan 1, 2008
25.505
-7.4
-22.49%
jan 1, 2009
18.474
-7.031
-27.57%
jan 1, 2010
22.564
+4.091
22.14%
jan 1, 2011
21.311
-1.253
-5.55%
jan 1, 2012
15.907
-5.404
-25.36%
jan 1, 2013
14.544
-1.363
-8.57%
Ranking of countries by current statistics by years


Comments: