29
/
en
AIzaSyAYiBZKx7MnpbEhh9jyipgxe19OcubqV5w
April 1, 2024
249742
St. Kitts and Nevis
KNA
true
2
1
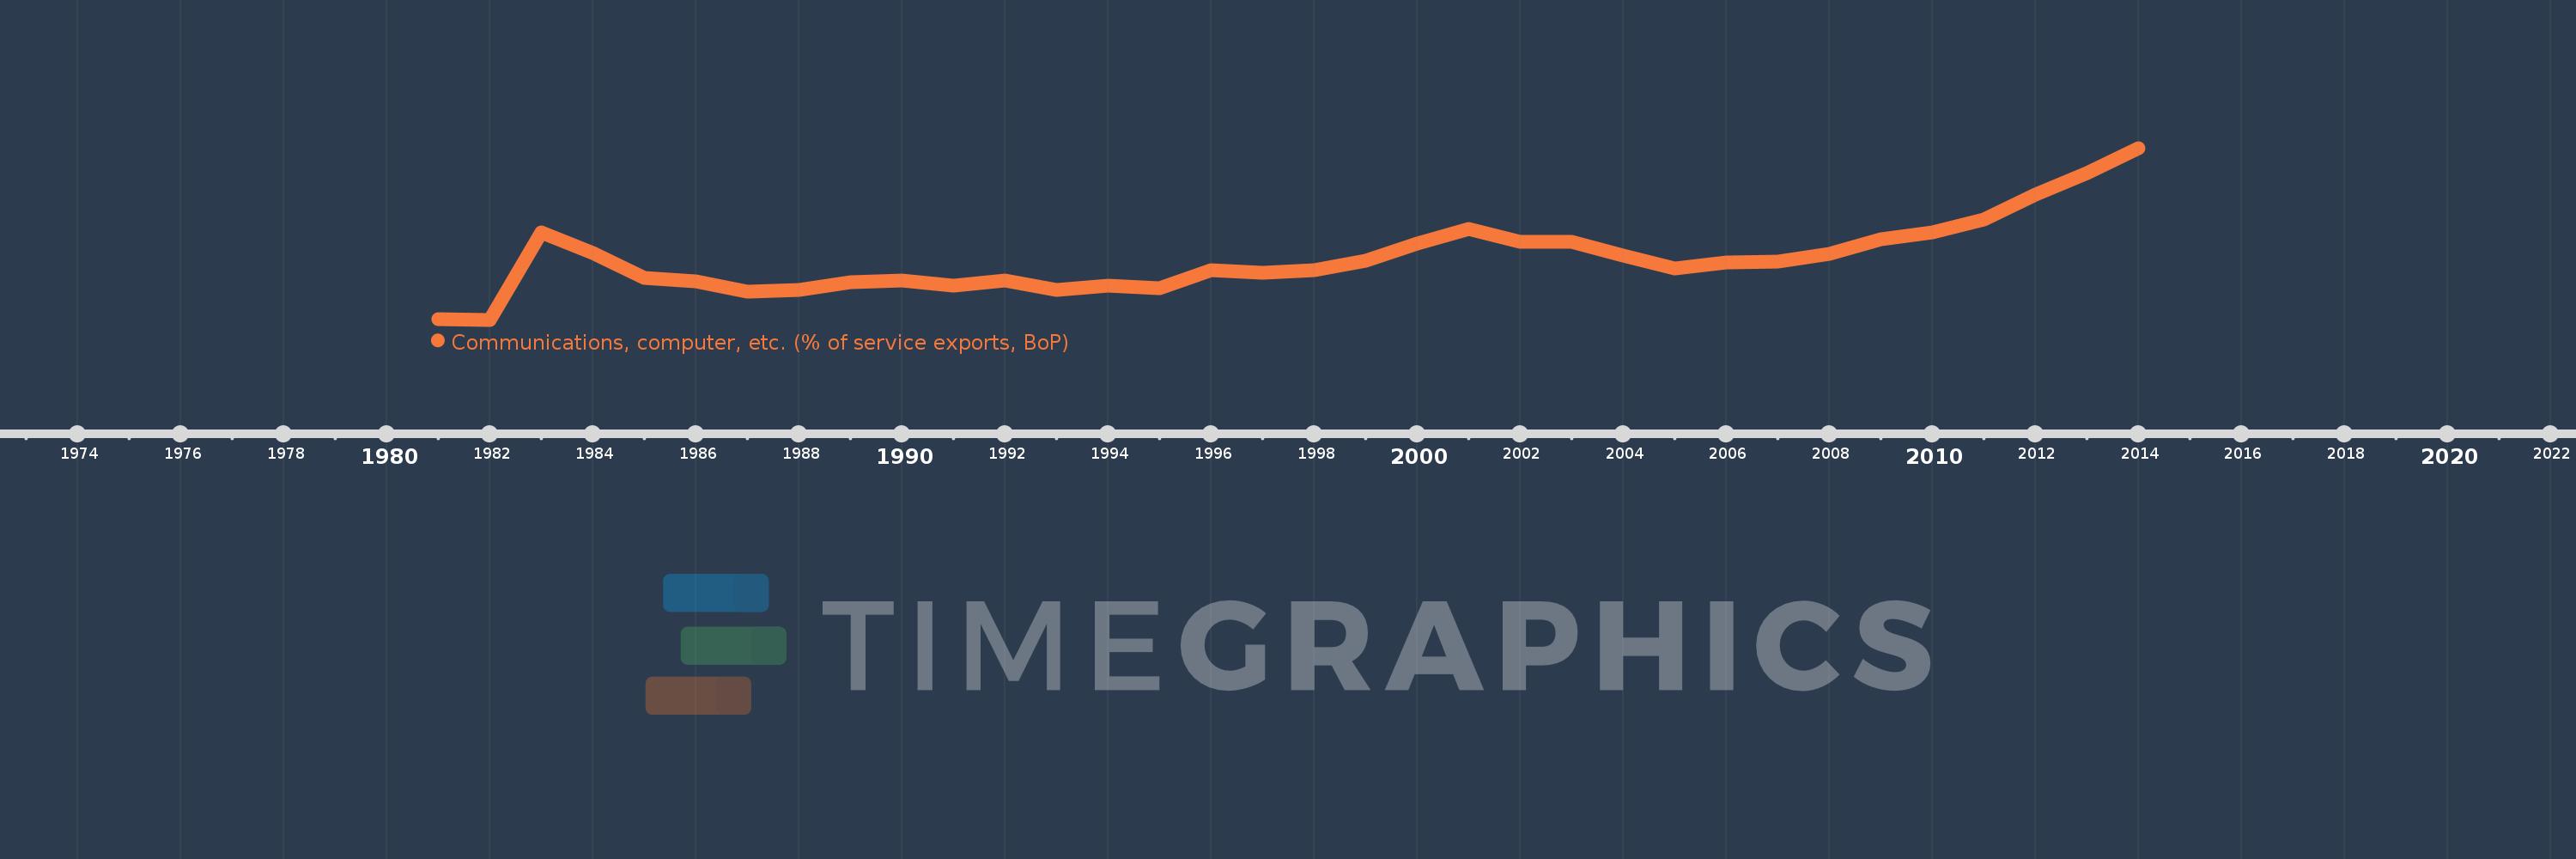
Communications, computer, etc. (% of service exports, BoP)
2014,2013,2012,2011,2010,2009,2008,2007,2006,2005,2004,2003,2002,2001,2000,1999,1998,1997,1996,1995,1994,1993,1992,1991,1990,1989,1988,1987,1986,1985,1984,1983,1982,1981
This statistics in other country:
AfghanistanAlbaniaAlgeriaAngolaAntigua and BarbudaArab WorldArgentinaArmeniaArubaAustraliaAustriaAzerbaijanBahamas, TheBahrainBangladeshBarbadosBelarusBelgiumBelizeBeninBermudaBhutanBoliviaBosnia and HerzegovinaBotswanaBrazilBrunei DarussalamBulgariaBurkina FasoBurundiCabo VerdeCambodiaCameroonCanadaCaribbean small statesCentral African RepublicCentral Europe and the BalticsChadChileChinaColombiaComorosCongo, Dem. Rep.Congo, Rep.Costa RicaCote d'IvoireCroatiaCuracaoCyprusCzech RepublicDenmarkDjiboutiDominicaDominican RepublicEarly-demographic dividendEast Asia & PacificEast Asia & Pacific (excluding high income)East Asia & Pacific (IDA & IBRD countries)EcuadorEgypt, Arab Rep.El SalvadorEquatorial GuineaEritreaEstoniaEthiopiaEuro areaEurope & Central AsiaEurope & Central Asia (excluding high income)Europe & Central Asia (IDA & IBRD countries)European UnionFaroe IslandsFijiFinlandFragile and conflict affected situationsFranceFrench PolynesiaGabonGambia, TheGeorgiaGermanyGhanaGreeceGrenadaGuatemalaGuineaGuinea-BissauGuyanaHaitiHeavily indebted poor countries (HIPC)High incomeHondurasHong Kong SAR, ChinaHungaryIBRD onlyIcelandIDA & IBRD totalIDA onlyIDA totalIndiaIndonesiaIran, Islamic Rep.IraqIrelandIsraelItalyJamaicaJapanJordanKazakhstanKenyaKiribatiKorea, Rep.KosovoKuwaitKyrgyz RepublicLao PDRLate-demographic dividendLatin America & Caribbean Latin America & Caribbean (excluding high income)Latin America & the Caribbean (IDA & IBRD countries)LatviaLeast developed countries: UN classificationLebanonLesothoLiberiaLibyaLithuaniaLow & middle incomeLow incomeLower middle incomeLuxembourgMacao SAR, ChinaMacedonia, FYRMadagascarMalawiMalaysiaMaldivesMaliMaltaMarshall IslandsMauritaniaMauritiusMexicoMicronesia, Fed. Sts.Middle East & North AfricaMiddle East & North Africa (excluding high income)Middle East & North Africa (IDA & IBRD countries)Middle incomeMoldovaMongoliaMontenegroMoroccoMozambiqueMyanmarNamibiaNepalNetherlandsNew CaledoniaNew ZealandNicaraguaNigerNigeriaNorth AmericaNorwayOECD membersOmanOther small statesPacific island small statesPakistanPalauPanamaPapua New GuineaParaguayPeruPhilippinesPolandPortugalPost-demographic dividendPre-demographic dividendQatarRomaniaRussian FederationRwandaSamoaSao Tome and PrincipeSaudi ArabiaSenegalSerbiaSeychellesSierra LeoneSingaporeSint Maarten (Dutch part)Slovak RepublicSloveniaSmall statesSolomon IslandsSouth AfricaSouth AsiaSouth Asia (IDA & IBRD)South SudanSpainSri LankaSt. Kitts and NevisSt. LuciaSt. Vincent and the GrenadinesSub-Saharan Africa Sub-Saharan Africa (excluding high income)Sub-Saharan Africa (IDA & IBRD countries)SudanSurinameSwazilandSwedenSwitzerlandSyrian Arab RepublicTajikistanTanzaniaThailandTimor-LesteTogoTongaTrinidad and TobagoTunisiaTurkeyTuvaluUgandaUkraineUnited KingdomUnited StatesUpper middle incomeUruguayVanuatuVenezuela, RBWest Bank and GazaWorldYemen, Rep.ZambiaZimbabwe Timeline:
This timeline shows a graph from 1981 to 2014 of St. Kitts and Nevis. No data until 1980. Number of actual observations by date: 34.
Source name:
World Development Indicators
Source organization:
International Monetary Fund, Balance of Payments Statistics Yearbook and data files.
Categories, topics:
Economy & Growth, Trade
Last updated:
apr 23, 2017
Indicators value changes by year
Maximum:
49.632
jan 1, 2014
At the date of observation
Value
Absolute change
Change from previous value
jan 1, 1981
1.235
+1.235
0.0%
jan 1, 1982
1.0
-0.235
-19.0%
jan 1, 1983
25.758
+24.758
2.48K%
jan 1, 1984
20.0
-5.758
-22.35%
jan 1, 1985
12.796
-7.204
-36.02%
jan 1, 1986
11.842
-0.954
-7.46%
jan 1, 1987
8.897
-2.945
-24.87%
jan 1, 1988
9.505
+0.608
6.84%
jan 1, 1989
11.511
+2.006
21.1%
jan 1, 1990
12.103
+0.592
5.14%
jan 1, 1991
10.749
-1.354
-11.19%
jan 1, 1992
12.04
+1.291
12.01%
jan 1, 1993
9.388
-2.652
-22.03%
jan 1, 1994
10.719
+1.331
14.18%
jan 1, 1995
10.015
-0.703
-6.56%
jan 1, 1996
14.951
+4.936
49.28%
jan 1, 1997
14.206
-0.745
-4.98%
jan 1, 1998
15.108
+0.901
6.35%
jan 1, 1999
17.753
+2.645
17.51%
jan 1, 2000
22.538
+4.785
26.95%
jan 1, 2001
26.749
+4.211
18.68%
jan 1, 2002
23.072
-3.677
-13.75%
jan 1, 2003
23.11
+0.038
0.17%
jan 1, 2004
19.18
-3.929
-17.0%
jan 1, 2005
15.437
-3.743
-19.51%
jan 1, 2006
17.23
+1.793
11.61%
jan 1, 2007
17.386
+0.156
0.91%
jan 1, 2008
19.625
+2.238
12.87%
jan 1, 2009
23.689
+4.065
20.71%
jan 1, 2010
25.763
+2.074
8.75%
jan 1, 2011
29.356
+3.593
13.95%
jan 1, 2012
36.441
+7.085
24.13%
jan 1, 2013
42.478
+6.037
16.57%
jan 1, 2014
49.632
+7.154
16.84%
Ranking of countries by current statistics by years


Comments: