29
/
en
AIzaSyAYiBZKx7MnpbEhh9jyipgxe19OcubqV5w
April 1, 2024
254996
Swaziland
SWZ
true
2
1
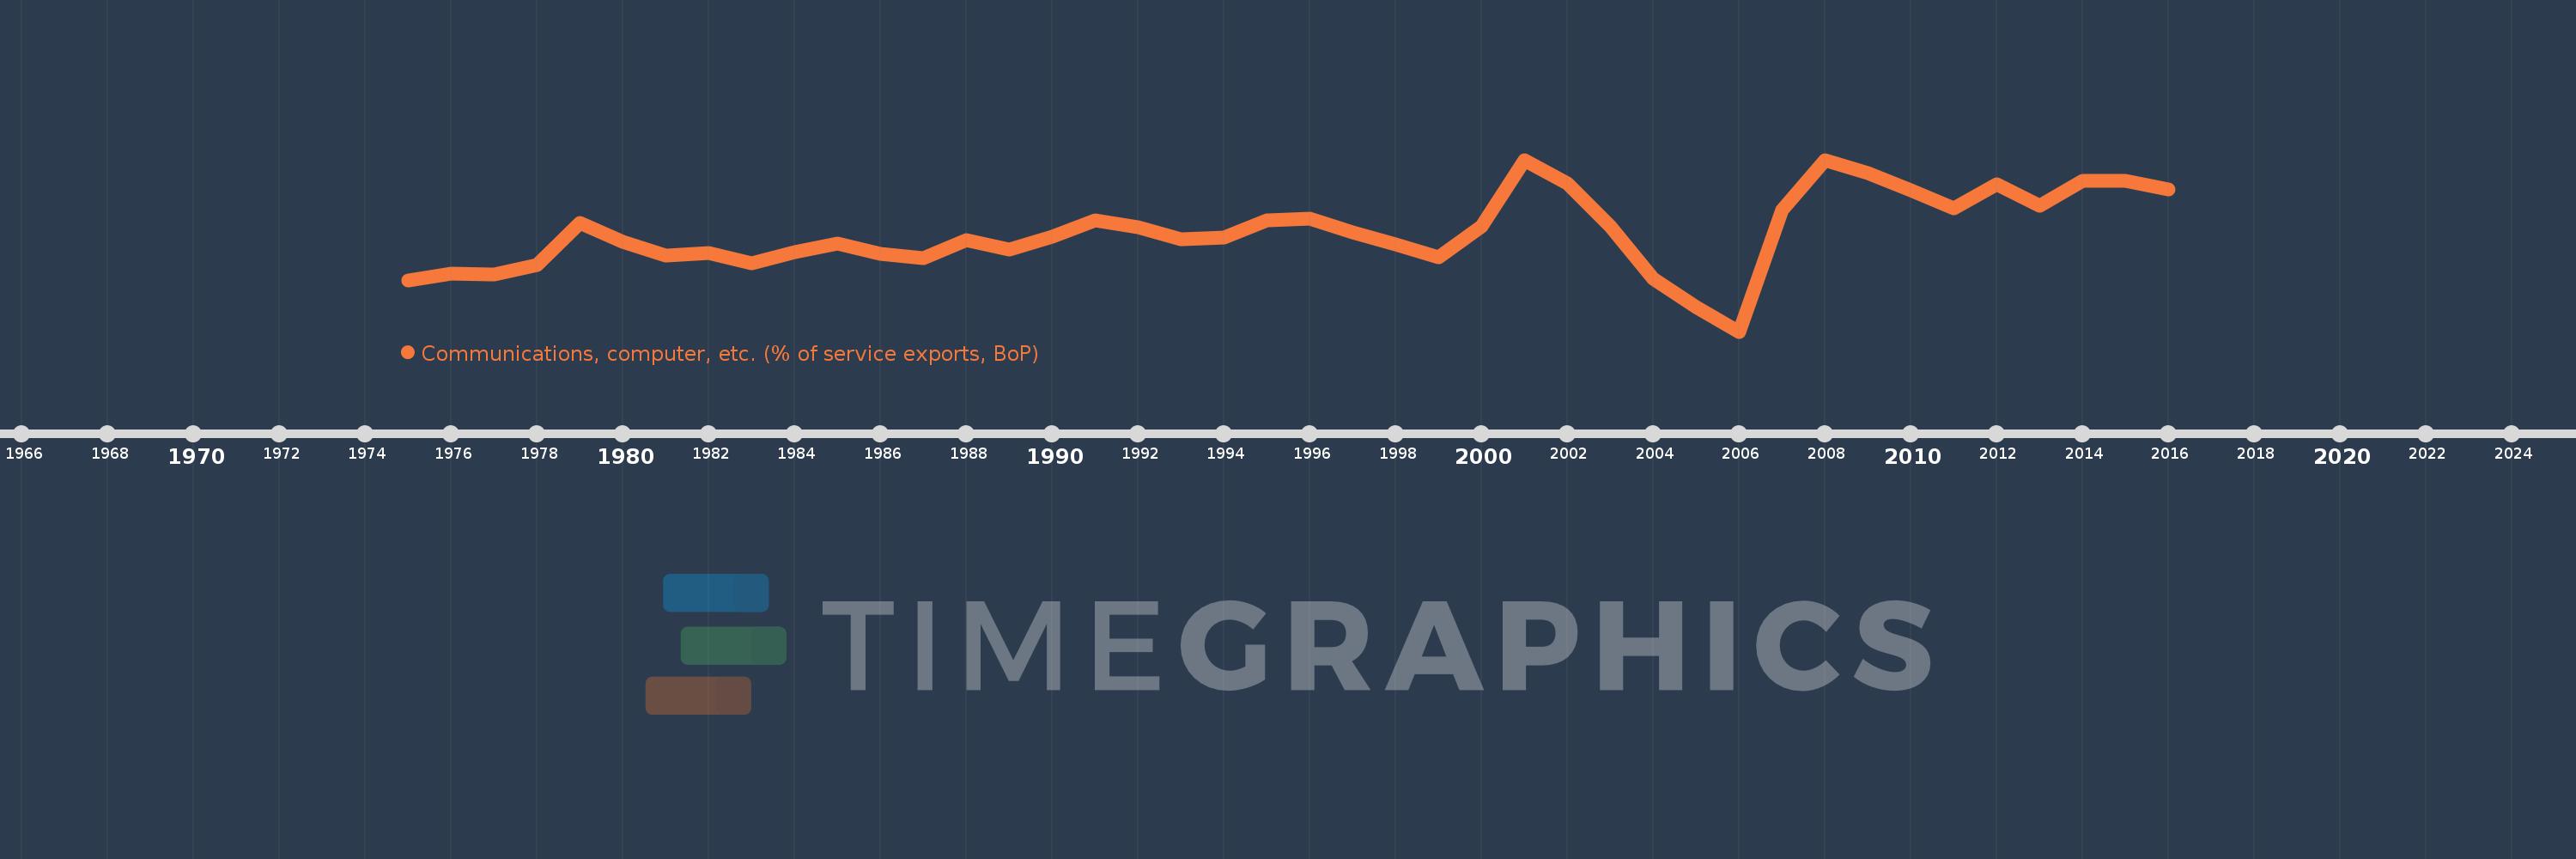
Communications, computer, etc. (% of service exports, BoP)
2016,2015,2014,2013,2012,2011,2010,2009,2008,2007,2006,2005,2004,2003,2002,2001,2000,1999,1998,1997,1996,1995,1994,1993,1992,1991,1990,1989,1988,1987,1986,1985,1984,1983,1982,1981,1980,1979,1978,1977,1976,1975
This statistics in other country:
AfghanistanAlbaniaAlgeriaAngolaAntigua and BarbudaArab WorldArgentinaArmeniaArubaAustraliaAustriaAzerbaijanBahamas, TheBahrainBangladeshBarbadosBelarusBelgiumBelizeBeninBermudaBhutanBoliviaBosnia and HerzegovinaBotswanaBrazilBrunei DarussalamBulgariaBurkina FasoBurundiCabo VerdeCambodiaCameroonCanadaCaribbean small statesCentral African RepublicCentral Europe and the BalticsChadChileChinaColombiaComorosCongo, Dem. Rep.Congo, Rep.Costa RicaCote d'IvoireCroatiaCuracaoCyprusCzech RepublicDenmarkDjiboutiDominicaDominican RepublicEarly-demographic dividendEast Asia & PacificEast Asia & Pacific (excluding high income)East Asia & Pacific (IDA & IBRD countries)EcuadorEgypt, Arab Rep.El SalvadorEquatorial GuineaEritreaEstoniaEthiopiaEuro areaEurope & Central AsiaEurope & Central Asia (excluding high income)Europe & Central Asia (IDA & IBRD countries)European UnionFaroe IslandsFijiFinlandFragile and conflict affected situationsFranceFrench PolynesiaGabonGambia, TheGeorgiaGermanyGhanaGreeceGrenadaGuatemalaGuineaGuinea-BissauGuyanaHaitiHeavily indebted poor countries (HIPC)High incomeHondurasHong Kong SAR, ChinaHungaryIBRD onlyIcelandIDA & IBRD totalIDA onlyIDA totalIndiaIndonesiaIran, Islamic Rep.IraqIrelandIsraelItalyJamaicaJapanJordanKazakhstanKenyaKiribatiKorea, Rep.KosovoKuwaitKyrgyz RepublicLao PDRLate-demographic dividendLatin America & Caribbean Latin America & Caribbean (excluding high income)Latin America & the Caribbean (IDA & IBRD countries)LatviaLeast developed countries: UN classificationLebanonLesothoLiberiaLibyaLithuaniaLow & middle incomeLow incomeLower middle incomeLuxembourgMacao SAR, ChinaMacedonia, FYRMadagascarMalawiMalaysiaMaldivesMaliMaltaMarshall IslandsMauritaniaMauritiusMexicoMicronesia, Fed. Sts.Middle East & North AfricaMiddle East & North Africa (excluding high income)Middle East & North Africa (IDA & IBRD countries)Middle incomeMoldovaMongoliaMontenegroMoroccoMozambiqueMyanmarNamibiaNepalNetherlandsNew CaledoniaNew ZealandNicaraguaNigerNigeriaNorth AmericaNorwayOECD membersOmanOther small statesPacific island small statesPakistanPalauPanamaPapua New GuineaParaguayPeruPhilippinesPolandPortugalPost-demographic dividendPre-demographic dividendQatarRomaniaRussian FederationRwandaSamoaSao Tome and PrincipeSaudi ArabiaSenegalSerbiaSeychellesSierra LeoneSingaporeSint Maarten (Dutch part)Slovak RepublicSloveniaSmall statesSolomon IslandsSouth AfricaSouth AsiaSouth Asia (IDA & IBRD)South SudanSpainSri LankaSt. Kitts and NevisSt. LuciaSt. Vincent and the GrenadinesSub-Saharan Africa Sub-Saharan Africa (excluding high income)Sub-Saharan Africa (IDA & IBRD countries)SudanSurinameSwazilandSwedenSwitzerlandSyrian Arab RepublicTajikistanTanzaniaThailandTimor-LesteTogoTongaTrinidad and TobagoTunisiaTurkeyTuvaluUgandaUkraineUnited KingdomUnited StatesUpper middle incomeUruguayVanuatuVenezuela, RBWest Bank and GazaWorldYemen, Rep.ZambiaZimbabwe Timeline:
This timeline shows a graph from 1975 to 2016 of Swaziland. No data until 1974. Number of actual observations by date: 42.
Source name:
World Development Indicators
Source organization:
International Monetary Fund, Balance of Payments Statistics Yearbook and data files.
Categories, topics:
Economy & Growth, Trade
Last updated:
apr 23, 2017
Indicators value changes by year
Minimum:
-17.849
jan 1, 2006
Maximum:
85.662
jan 1, 2001
At the date of observation
Value
Absolute change
Change from previous value
jan 1, 1975
12.821
+12.821
0.0%
jan 1, 1976
17.297
+4.477
34.92%
jan 1, 1977
16.518
-0.779
-4.51%
jan 1, 1978
22.047
+5.529
33.48%
jan 1, 1979
47.429
+25.381
115.12%
jan 1, 1980
35.985
-11.444
-24.13%
jan 1, 1981
27.758
-8.227
-22.86%
jan 1, 1982
29.477
+1.719
6.19%
jan 1, 1983
23.529
-5.947
-20.18%
jan 1, 1984
30.283
+6.754
28.7%
jan 1, 1985
35.093
+4.81
15.88%
jan 1, 1986
28.756
-6.337
-18.06%
jan 1, 1987
26.422
-2.334
-8.12%
jan 1, 1988
37.477
+11.056
41.84%
jan 1, 1989
31.338
-6.139
-16.38%
jan 1, 1990
39.437
+8.098
25.84%
jan 1, 1991
49.138
+9.701
24.6%
jan 1, 1992
45.083
-4.055
-8.25%
jan 1, 1993
37.776
-7.307
-16.21%
jan 1, 1994
39.058
+1.282
3.39%
jan 1, 1995
49.286
+10.228
26.19%
jan 1, 1996
50.229
+0.943
1.91%
jan 1, 1997
41.796
-8.433
-16.79%
jan 1, 1998
34.821
-6.975
-16.69%
jan 1, 1999
27.133
-7.687
-22.08%
jan 1, 2000
45.677
+18.544
68.34%
jan 1, 2001
85.662
+39.985
87.54%
jan 1, 2002
71.682
-13.98
-16.32%
jan 1, 2003
45.424
-26.258
-36.63%
jan 1, 2004
13.725
-31.699
-69.79%
jan 1, 2005
-2.985
-16.71
-121.75%
jan 1, 2006
-17.849
-14.864
497.87%
jan 1, 2007
55.569
+73.418
-411.32%
jan 1, 2008
85.508
+29.939
53.88%
jan 1, 2009
77.859
-7.649
-8.94%
jan 1, 2010
67.483
-10.376
-13.33%
jan 1, 2011
56.563
-10.92
-16.18%
jan 1, 2012
71.167
+14.604
25.82%
jan 1, 2013
58.026
-13.141
-18.46%
jan 1, 2014
72.987
+14.961
25.78%
jan 1, 2015
72.893
-0.094
-0.13%
jan 1, 2016
67.581
-5.313
-7.29%
Ranking of countries by current statistics by years


Comments: