29
/
en
AIzaSyAYiBZKx7MnpbEhh9jyipgxe19OcubqV5w
April 1, 2024
191226
Malta
MLT
true
2
1
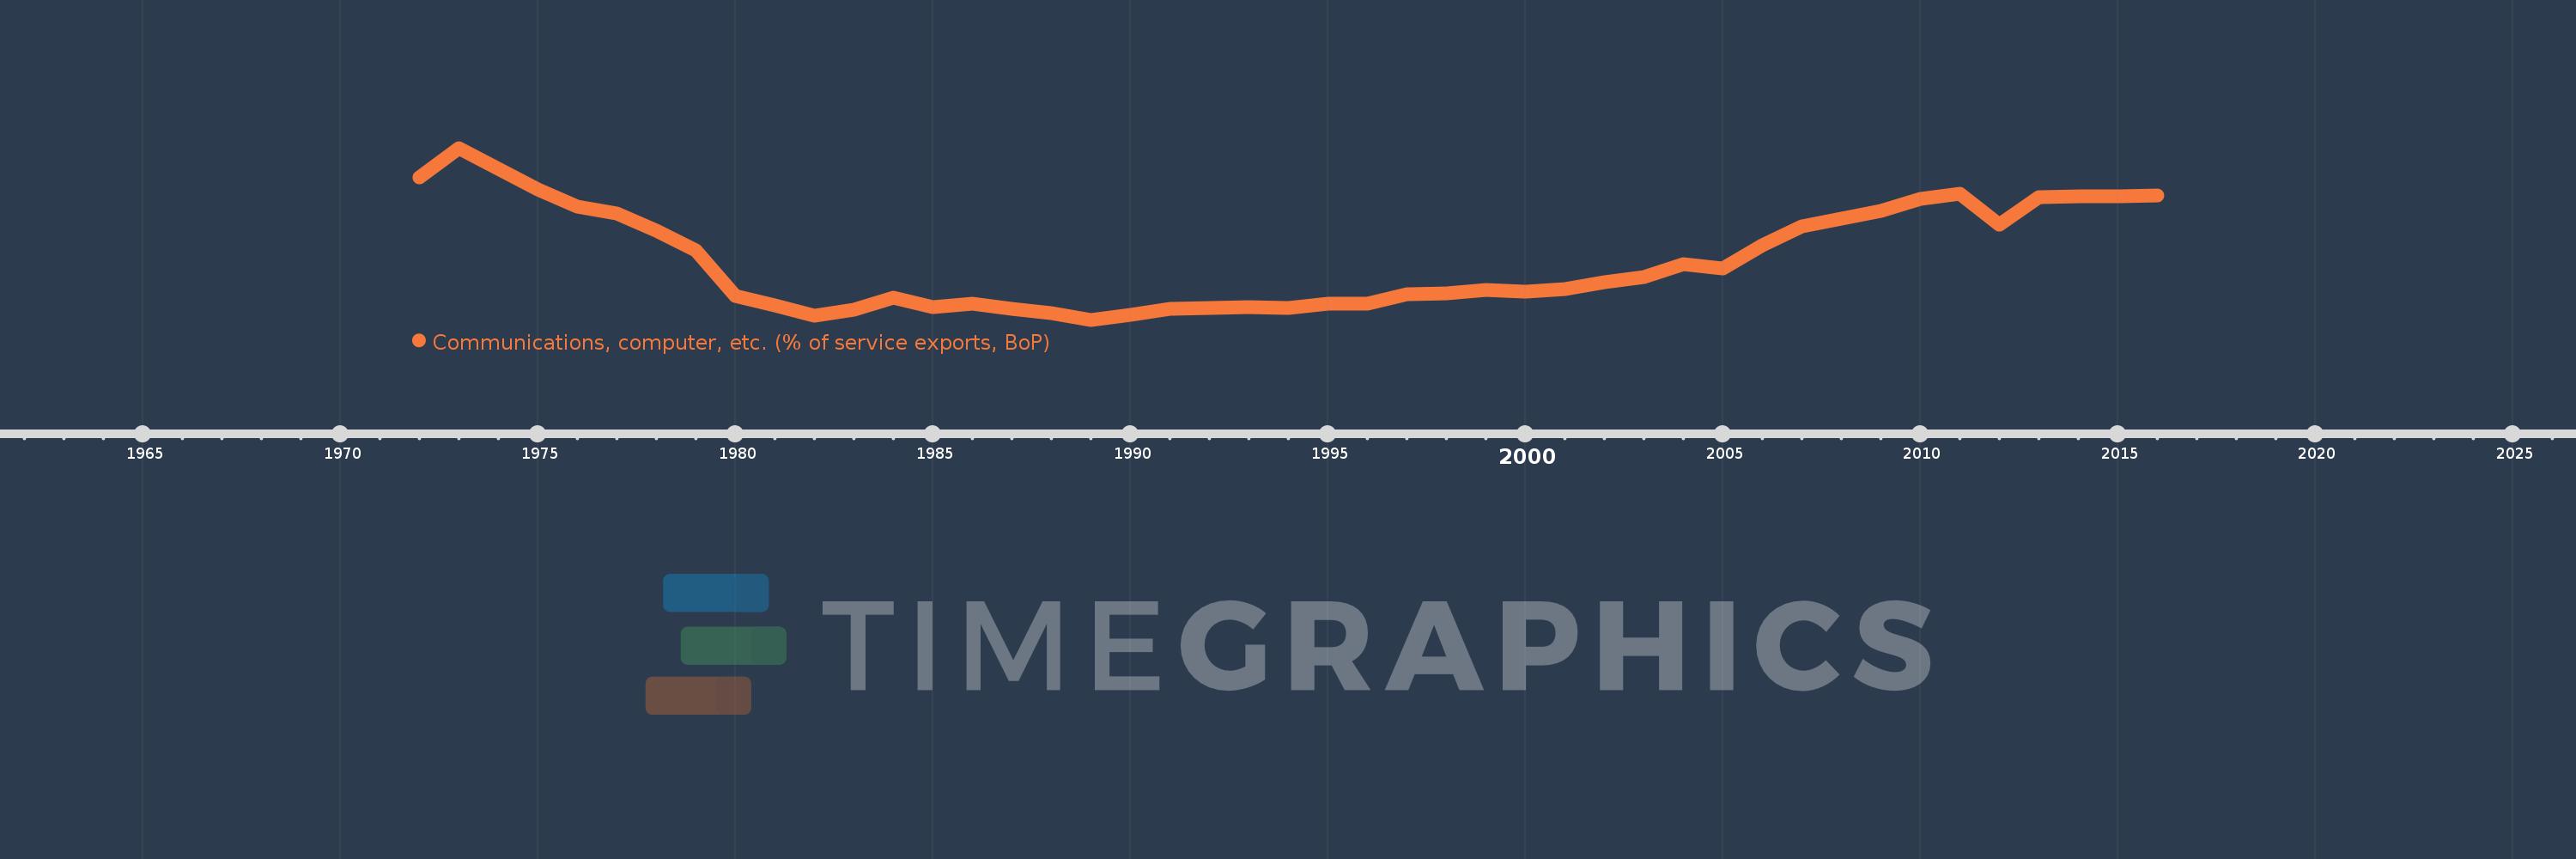
Communications, computer, etc. (% of service exports, BoP)
2016,2015,2014,2013,2012,2011,2010,2009,2008,2007,2006,2005,2004,2003,2002,2001,2000,1999,1998,1997,1996,1995,1994,1993,1992,1991,1990,1989,1988,1987,1986,1985,1984,1983,1982,1981,1980,1979,1978,1977,1976,1975,1974,1973,1972
This statistics in other country:
AfghanistanAlbaniaAlgeriaAngolaAntigua and BarbudaArab WorldArgentinaArmeniaArubaAustraliaAustriaAzerbaijanBahamas, TheBahrainBangladeshBarbadosBelarusBelgiumBelizeBeninBermudaBhutanBoliviaBosnia and HerzegovinaBotswanaBrazilBrunei DarussalamBulgariaBurkina FasoBurundiCabo VerdeCambodiaCameroonCanadaCaribbean small statesCentral African RepublicCentral Europe and the BalticsChadChileChinaColombiaComorosCongo, Dem. Rep.Congo, Rep.Costa RicaCote d'IvoireCroatiaCuracaoCyprusCzech RepublicDenmarkDjiboutiDominicaDominican RepublicEarly-demographic dividendEast Asia & PacificEast Asia & Pacific (excluding high income)East Asia & Pacific (IDA & IBRD countries)EcuadorEgypt, Arab Rep.El SalvadorEquatorial GuineaEritreaEstoniaEthiopiaEuro areaEurope & Central AsiaEurope & Central Asia (excluding high income)Europe & Central Asia (IDA & IBRD countries)European UnionFaroe IslandsFijiFinlandFragile and conflict affected situationsFranceFrench PolynesiaGabonGambia, TheGeorgiaGermanyGhanaGreeceGrenadaGuatemalaGuineaGuinea-BissauGuyanaHaitiHeavily indebted poor countries (HIPC)High incomeHondurasHong Kong SAR, ChinaHungaryIBRD onlyIcelandIDA & IBRD totalIDA onlyIDA totalIndiaIndonesiaIran, Islamic Rep.IraqIrelandIsraelItalyJamaicaJapanJordanKazakhstanKenyaKiribatiKorea, Rep.KosovoKuwaitKyrgyz RepublicLao PDRLate-demographic dividendLatin America & Caribbean Latin America & Caribbean (excluding high income)Latin America & the Caribbean (IDA & IBRD countries)LatviaLeast developed countries: UN classificationLebanonLesothoLiberiaLibyaLithuaniaLow & middle incomeLow incomeLower middle incomeLuxembourgMacao SAR, ChinaMacedonia, FYRMadagascarMalawiMalaysiaMaldivesMaliMaltaMarshall IslandsMauritaniaMauritiusMexicoMicronesia, Fed. Sts.Middle East & North AfricaMiddle East & North Africa (excluding high income)Middle East & North Africa (IDA & IBRD countries)Middle incomeMoldovaMongoliaMontenegroMoroccoMozambiqueMyanmarNamibiaNepalNetherlandsNew CaledoniaNew ZealandNicaraguaNigerNigeriaNorth AmericaNorwayOECD membersOmanOther small statesPacific island small statesPakistanPalauPanamaPapua New GuineaParaguayPeruPhilippinesPolandPortugalPost-demographic dividendPre-demographic dividendQatarRomaniaRussian FederationRwandaSamoaSao Tome and PrincipeSaudi ArabiaSenegalSerbiaSeychellesSierra LeoneSingaporeSint Maarten (Dutch part)Slovak RepublicSloveniaSmall statesSolomon IslandsSouth AfricaSouth AsiaSouth Asia (IDA & IBRD)South SudanSpainSri LankaSt. Kitts and NevisSt. LuciaSt. Vincent and the GrenadinesSub-Saharan Africa Sub-Saharan Africa (excluding high income)Sub-Saharan Africa (IDA & IBRD countries)SudanSurinameSwazilandSwedenSwitzerlandSyrian Arab RepublicTajikistanTanzaniaThailandTimor-LesteTogoTongaTrinidad and TobagoTunisiaTurkeyTuvaluUgandaUkraineUnited KingdomUnited StatesUpper middle incomeUruguayVanuatuVenezuela, RBWest Bank and GazaWorldYemen, Rep.ZambiaZimbabwe Timeline:
This timeline shows a graph from 1972 to 2016 of Malta. No data until 1971. Number of actual observations by date: 45.
Source name:
World Development Indicators
Source organization:
International Monetary Fund, Balance of Payments Statistics Yearbook and data files.
Categories, topics:
Economy & Growth, Trade
Last updated:
apr 23, 2017
Indicators value changes by year
Maximum:
68.116
jan 1, 1973
At the date of observation
Value
Absolute change
Change from previous value
jan 1, 1972
57.357
+57.357
0.0%
jan 1, 1973
68.116
+10.759
18.76%
jan 1, 1974
60.446
-7.67
-11.26%
jan 1, 1975
52.749
-7.697
-12.73%
jan 1, 1976
46.492
-6.257
-11.86%
jan 1, 1977
44.079
-2.413
-5.19%
jan 1, 1978
37.62
-6.459
-14.65%
jan 1, 1979
30.354
-7.267
-19.32%
jan 1, 1980
13.592
-16.761
-55.22%
jan 1, 1981
10.229
-3.364
-24.75%
jan 1, 1982
6.152
-4.077
-39.86%
jan 1, 1983
8.485
+2.333
37.93%
jan 1, 1984
12.848
+4.362
51.41%
jan 1, 1985
9.437
-3.411
-26.55%
jan 1, 1986
10.67
+1.233
13.06%
jan 1, 1987
8.791
-1.879
-17.61%
jan 1, 1988
7.169
-1.622
-18.45%
jan 1, 1989
4.813
-2.356
-32.87%
jan 1, 1990
6.723
+1.91
39.7%
jan 1, 1991
8.929
+2.206
32.82%
jan 1, 1992
9.195
+0.266
2.98%
jan 1, 1993
9.514
+0.318
3.46%
jan 1, 1994
9.037
-0.477
-5.01%
jan 1, 1995
10.662
+1.626
17.99%
jan 1, 1996
10.862
+0.2
1.87%
jan 1, 1997
14.236
+3.374
31.06%
jan 1, 1998
14.558
+0.322
2.26%
jan 1, 1999
15.757
+1.199
8.24%
jan 1, 2000
15.18
-0.577
-3.66%
jan 1, 2001
16.227
+1.047
6.9%
jan 1, 2002
18.601
+2.374
14.63%
jan 1, 2003
20.677
+2.076
11.16%
jan 1, 2004
25.28
+4.603
22.26%
jan 1, 2005
23.631
-1.649
-6.52%
jan 1, 2006
32.236
+8.605
36.42%
jan 1, 2007
39.241
+7.004
21.73%
jan 1, 2008
42.013
+2.773
7.07%
jan 1, 2009
44.944
+2.93
6.97%
jan 1, 2010
49.389
+4.445
9.89%
jan 1, 2011
51.308
+1.919
3.89%
jan 1, 2012
39.907
-11.401
-22.22%
jan 1, 2013
50.109
+10.202
25.56%
jan 1, 2014
50.216
+0.107
0.21%
jan 1, 2015
50.449
+0.233
0.46%
jan 1, 2016
50.503
+0.054
0.11%
Ranking of countries by current statistics by years


Comments: