29
/
en
AIzaSyAYiBZKx7MnpbEhh9jyipgxe19OcubqV5w
April 1, 2024
97129
Cabo Verde
CPV
true
2
1
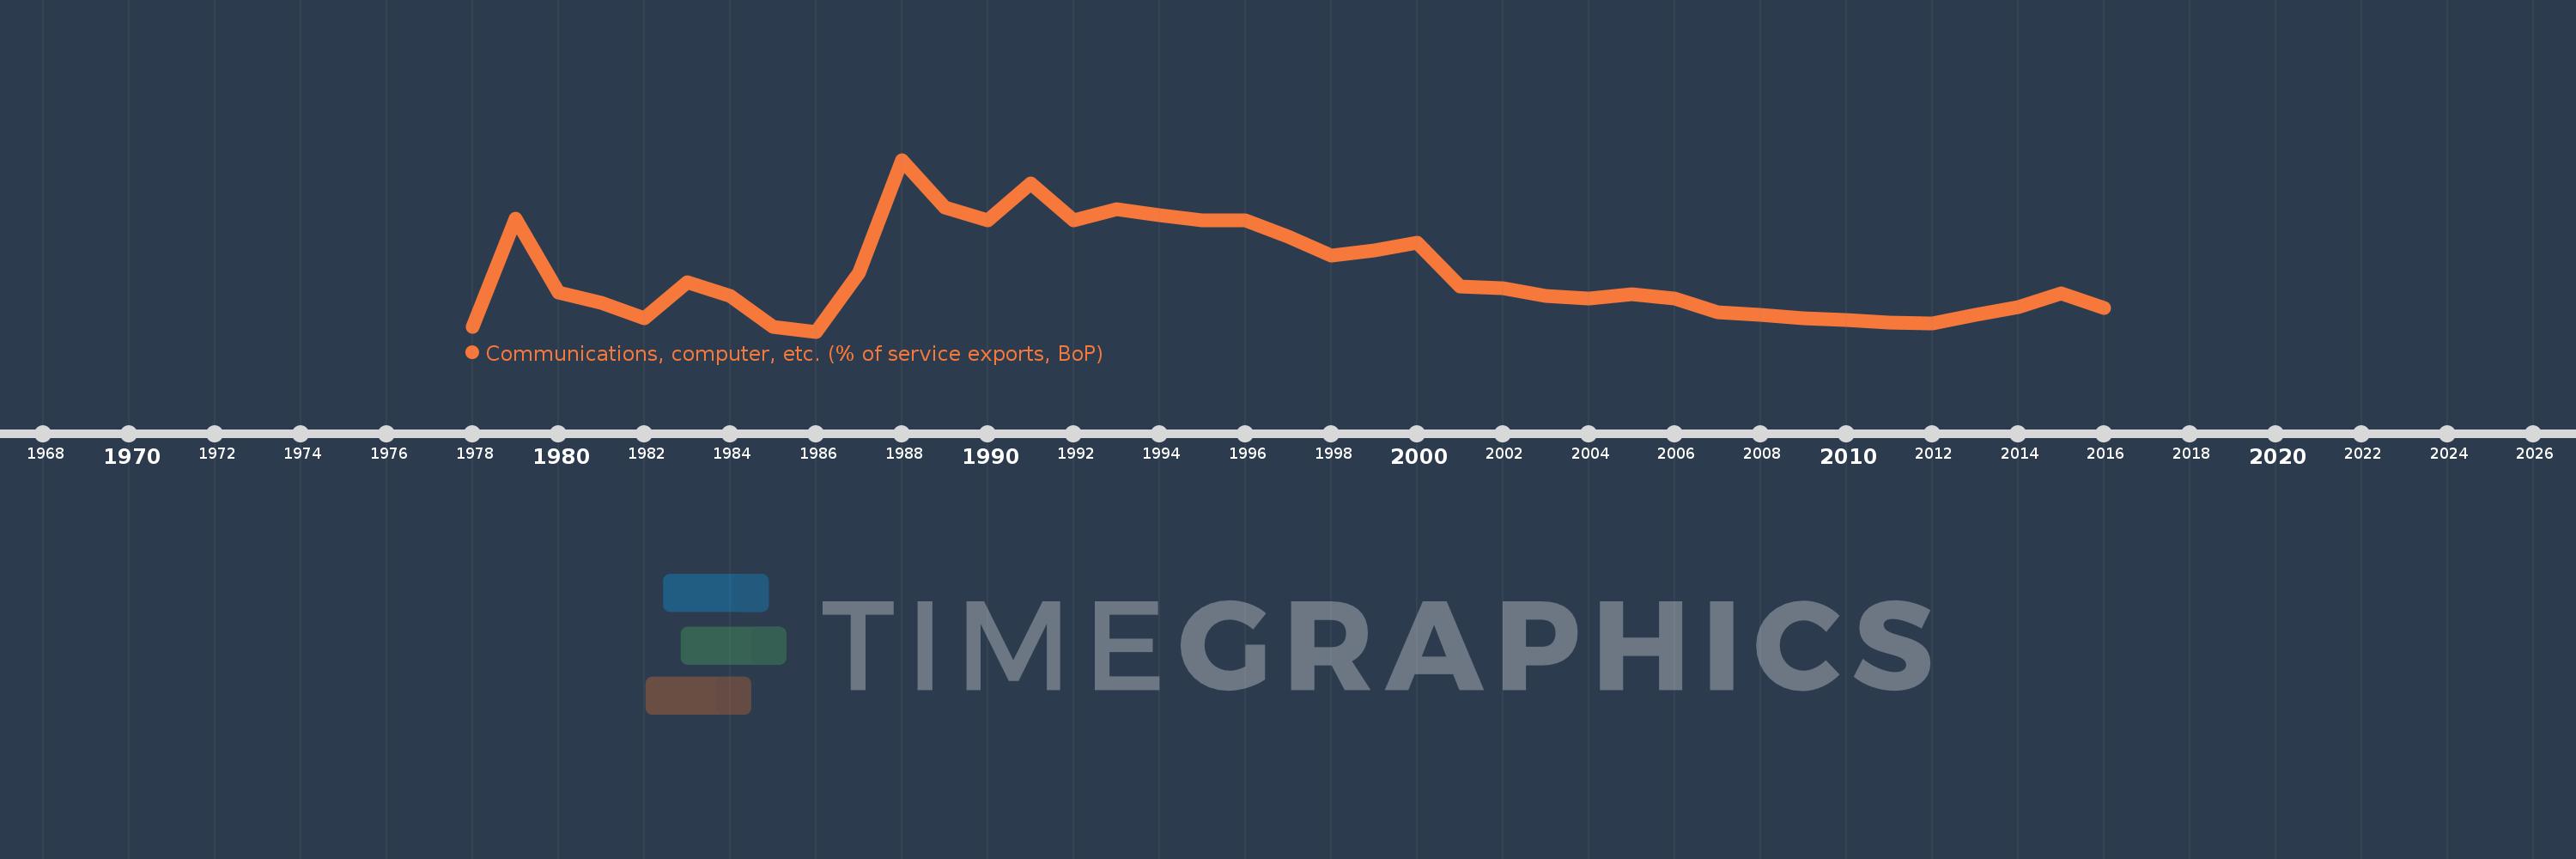
Communications, computer, etc. (% of service exports, BoP)
2016,2015,2014,2013,2012,2011,2010,2009,2008,2007,2006,2005,2004,2003,2002,2001,2000,1999,1998,1997,1996,1995,1994,1993,1992,1991,1990,1989,1988,1987,1986,1985,1984,1983,1982,1981,1980,1979,1978
This statistics in other country:
AfghanistanAlbaniaAlgeriaAngolaAntigua and BarbudaArab WorldArgentinaArmeniaArubaAustraliaAustriaAzerbaijanBahamas, TheBahrainBangladeshBarbadosBelarusBelgiumBelizeBeninBermudaBhutanBoliviaBosnia and HerzegovinaBotswanaBrazilBrunei DarussalamBulgariaBurkina FasoBurundiCabo VerdeCambodiaCameroonCanadaCaribbean small statesCentral African RepublicCentral Europe and the BalticsChadChileChinaColombiaComorosCongo, Dem. Rep.Congo, Rep.Costa RicaCote d'IvoireCroatiaCuracaoCyprusCzech RepublicDenmarkDjiboutiDominicaDominican RepublicEarly-demographic dividendEast Asia & PacificEast Asia & Pacific (excluding high income)East Asia & Pacific (IDA & IBRD countries)EcuadorEgypt, Arab Rep.El SalvadorEquatorial GuineaEritreaEstoniaEthiopiaEuro areaEurope & Central AsiaEurope & Central Asia (excluding high income)Europe & Central Asia (IDA & IBRD countries)European UnionFaroe IslandsFijiFinlandFragile and conflict affected situationsFranceFrench PolynesiaGabonGambia, TheGeorgiaGermanyGhanaGreeceGrenadaGuatemalaGuineaGuinea-BissauGuyanaHaitiHeavily indebted poor countries (HIPC)High incomeHondurasHong Kong SAR, ChinaHungaryIBRD onlyIcelandIDA & IBRD totalIDA onlyIDA totalIndiaIndonesiaIran, Islamic Rep.IraqIrelandIsraelItalyJamaicaJapanJordanKazakhstanKenyaKiribatiKorea, Rep.KosovoKuwaitKyrgyz RepublicLao PDRLate-demographic dividendLatin America & Caribbean Latin America & Caribbean (excluding high income)Latin America & the Caribbean (IDA & IBRD countries)LatviaLeast developed countries: UN classificationLebanonLesothoLiberiaLibyaLithuaniaLow & middle incomeLow incomeLower middle incomeLuxembourgMacao SAR, ChinaMacedonia, FYRMadagascarMalawiMalaysiaMaldivesMaliMaltaMarshall IslandsMauritaniaMauritiusMexicoMicronesia, Fed. Sts.Middle East & North AfricaMiddle East & North Africa (excluding high income)Middle East & North Africa (IDA & IBRD countries)Middle incomeMoldovaMongoliaMontenegroMoroccoMozambiqueMyanmarNamibiaNepalNetherlandsNew CaledoniaNew ZealandNicaraguaNigerNigeriaNorth AmericaNorwayOECD membersOmanOther small statesPacific island small statesPakistanPalauPanamaPapua New GuineaParaguayPeruPhilippinesPolandPortugalPost-demographic dividendPre-demographic dividendQatarRomaniaRussian FederationRwandaSamoaSao Tome and PrincipeSaudi ArabiaSenegalSerbiaSeychellesSierra LeoneSingaporeSint Maarten (Dutch part)Slovak RepublicSloveniaSmall statesSolomon IslandsSouth AfricaSouth AsiaSouth Asia (IDA & IBRD)South SudanSpainSri LankaSt. Kitts and NevisSt. LuciaSt. Vincent and the GrenadinesSub-Saharan Africa Sub-Saharan Africa (excluding high income)Sub-Saharan Africa (IDA & IBRD countries)SudanSurinameSwazilandSwedenSwitzerlandSyrian Arab RepublicTajikistanTanzaniaThailandTimor-LesteTogoTongaTrinidad and TobagoTunisiaTurkeyTuvaluUgandaUkraineUnited KingdomUnited StatesUpper middle incomeUruguayVanuatuVenezuela, RBWest Bank and GazaWorldYemen, Rep.ZambiaZimbabwe Timeline:
This timeline shows a graph from 1978 to 2016 of Cabo Verde. No data until 1977. Number of actual observations by date: 39.
Source name:
World Development Indicators
Source organization:
International Monetary Fund, Balance of Payments Statistics Yearbook and data files.
Categories, topics:
Economy & Growth, Trade
Last updated:
apr 23, 2017
Indicators value changes by year
Maximum:
52.296
jan 1, 1988
At the date of observation
Value
Absolute change
Change from previous value
jan 1, 1978
8.896
+8.896
0.0%
jan 1, 1979
37.004
+28.108
315.97%
jan 1, 1980
17.705
-19.299
-52.15%
jan 1, 1981
15.189
-2.516
-14.21%
jan 1, 1982
11.16
-4.029
-26.53%
jan 1, 1983
20.532
+9.373
83.99%
jan 1, 1984
16.877
-3.655
-17.8%
jan 1, 1985
8.811
-8.066
-47.79%
jan 1, 1986
7.626
-1.185
-13.45%
jan 1, 1987
22.825
+15.199
199.3%
jan 1, 1988
52.296
+29.472
129.12%
jan 1, 1989
39.807
-12.49
-23.88%
jan 1, 1990
36.617
-3.189
-8.01%
jan 1, 1991
46.195
+9.578
26.16%
jan 1, 1992
36.624
-9.571
-20.72%
jan 1, 1993
39.476
+2.852
7.79%
jan 1, 1994
37.883
-1.592
-4.03%
jan 1, 1995
36.659
-1.225
-3.23%
jan 1, 1996
36.45
-0.208
-0.57%
jan 1, 1997
32.326
-4.124
-11.31%
jan 1, 1998
27.418
-4.908
-15.18%
jan 1, 1999
28.772
+1.354
4.94%
jan 1, 2000
30.727
+1.956
6.8%
jan 1, 2001
19.363
-11.364
-36.98%
jan 1, 2002
18.933
-0.43
-2.22%
jan 1, 2003
16.975
-1.958
-10.34%
jan 1, 2004
16.241
-0.735
-4.33%
jan 1, 2005
17.441
+1.2
7.39%
jan 1, 2006
16.219
-1.221
-7.0%
jan 1, 2007
12.613
-3.607
-22.24%
jan 1, 2008
12.025
-0.588
-4.66%
jan 1, 2009
11.058
-0.967
-8.04%
jan 1, 2010
10.546
-0.512
-4.63%
jan 1, 2011
9.95
-0.595
-5.64%
jan 1, 2012
9.772
-0.178
-1.79%
jan 1, 2013
12.09
+2.318
23.72%
jan 1, 2014
14.098
+2.008
16.61%
jan 1, 2015
17.459
+3.36
23.84%
jan 1, 2016
13.676
-3.783
-21.67%
Ranking of countries by current statistics by years


Comments: